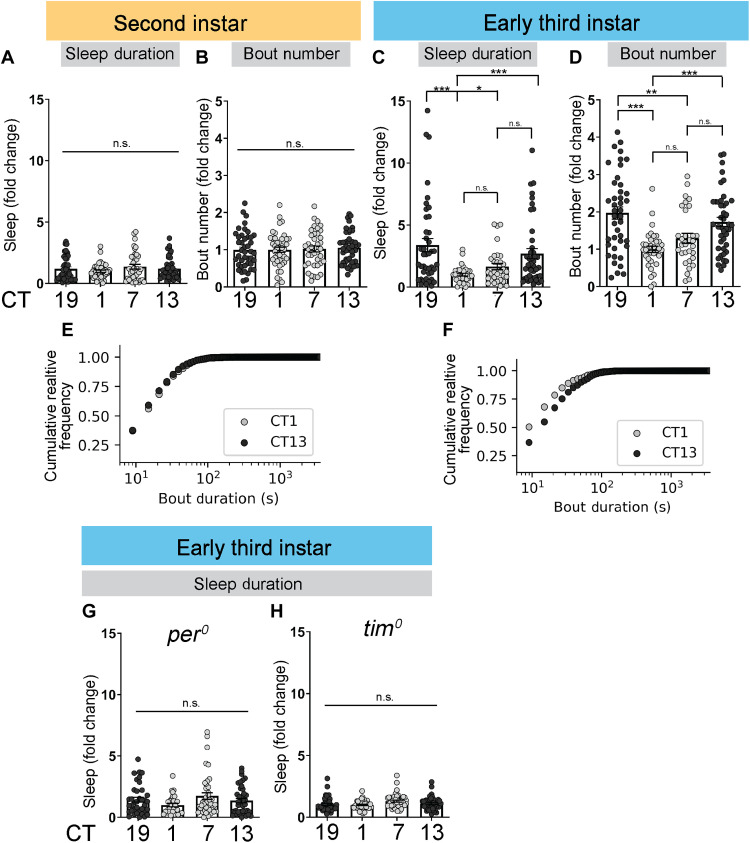
Fig. 1. Rhythmic sleep emerges in early third-instar (L3).
(A to D) Sleep duration and sleep bout number across the day under constant dark conditions in second-instar (L2) (A and B) and L3 (C and D). (E and F) Cumulative relative frequency of sleep bout duration at circadian time 1 (CT1) and CT13 for L2 (E) and L3 (F). (G and H) Sleep duration in L3 clock mutants. The subjective day is shown in light gray circles and the subjective night in black. Sleep metrics represent fold change (normalized to the average value at CT1 for a given panel). (A to D, G, and H) n = 31 to 44 larvae. One-way analysis of variance (ANOVA) followed by Tukey’s multiple comparison tests (A to D, G, and H); Kolmogorov-Smirnov test (E and F). For this and all other figures unless otherwise specified, data are presented as means ± SEM; n.s., not significant; *P < 0.05, **P < 0.01, and ***P < 0.001.

