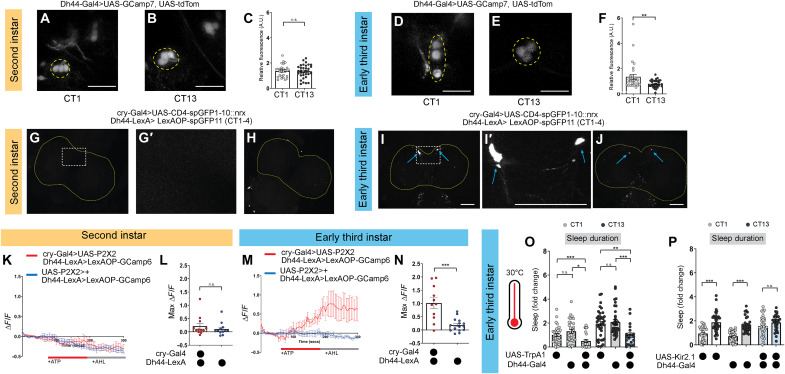
Fig. 3. Dh44 neurons anatomically and functionally connect with DN1as in early third-instar (L3).
(A and B) Dh44-Gal4 > UAS-GCaMP7f expression in second-instar (L2) brains at circadian time 1 (CT1) and CT13. (C) GCaMP intensity in Dh44 neurons in L2 at CT1 and CT13. Yellow dotted lines = Dh44 cell bodies. (D and E) Dh44-Gal4 > UAS-GCaMP7f expression in L3 brains at CT1 and CT13. (F) GCaMP intensity in Dh44 neurons in L3 at CT1 and CT13. (G to J) Neurexin-based green fluorescent protein (GFP) reconstitution (GRASP, GFP reconstitution across synaptic partners) between DN1as (cry-Gal4) and Dh44 neurons (Dh44-LexA) in L2 (G and H) and L3 (I and J) brains. Yellow dotted lines = brain; blue arrows = Dh44 cell bodies. Higher magnification of the region of interest in (G) and (I) is shown in (G′) and (I′). (K and M) GCaMP6 signal in Dh44 neurons with the activation of DN1a neurons in L2 (K) and L3 (M). The red bar indicates adenosine 5′-triphosphate (ATP) application and the gray bar indicates artificial hemolymph (AHL) application. (L and N) Maximum GCaMP change (ΔF/F) for individual cells in L2 (L) and L3 (N). (O) Sleep duration in L3 expressing Dh44-Gal4 > UAS-TrpA1 and genetic controls at CT1 and CT13. (P) Sleep duration in L3 expressing Dh44-Gal4 > UAS-Kir2.1 and genetic controls at CT1 and CT13. (C) n = 32 to 37 cells, 10 to 11 brains; (F) n = 30 cells, 10 brains; (G to J) n = 8 to 10 brains; (K to N) n = 9 to 15 cells, 8 brains; (O) n = 20 to 36 larvae; (P) n = 27 to 33 larvae. Unpaired two-tailed Student’s t test (C, F, M, and N); one-way analyses of variance (ANOVAs) followed by Tukey’s multiple comparison tests (O and P). Scale bars, 25 μm (for A, B, D, and E) and, 50 μm (for G to J). A.U. arbitrary units.

