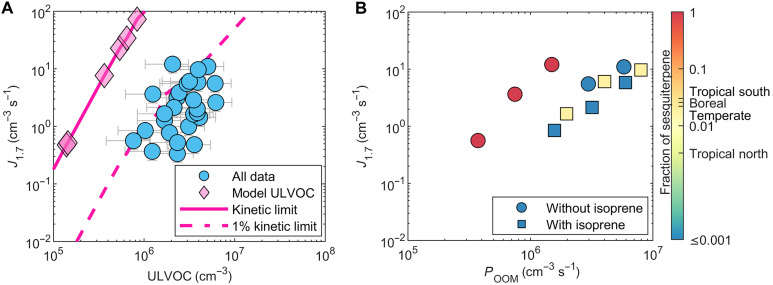
Fig. 6. Pure biogenic nucleation relative to ULVOC kinetic limit.
(A) Particle formation rates at 1.7 nm (J1.7) versus ULVOC measured with NO3-CIMS for all data (blue circles; table S1), at T = +5°C and +25°C and RH = 5 to 90% in the presence or absence of NO and any combination of α-pinene, β-caryophyllene, and isoprene. The formation rates derived from our kinetic model calculation for ULVOC nucleation are shown as diamonds, which are fitted by the magenta solid line (see the “Kinetic model for ULVOC nucleation” section in Materials and Methods); the dashed line simulates 1% kinetic limit (1% kinetic limit is calculated from dividing Jkinetic by a factor 100). (B) Particle formation rates versus OOM production rate for different BVOC systems, where the points are colored according to the sesquiterpene molar fraction (injection concentrations). The experimental conditions are 5°C and RH = 40%. For comparison, Messina et al. (13) find in their emission budgets average sesquiterpene fractions of between 0.019 to 0.03 for boreal, temperate, and tropical southern regions and 0.003 for tropical northern regions shown in the color bar axis.

