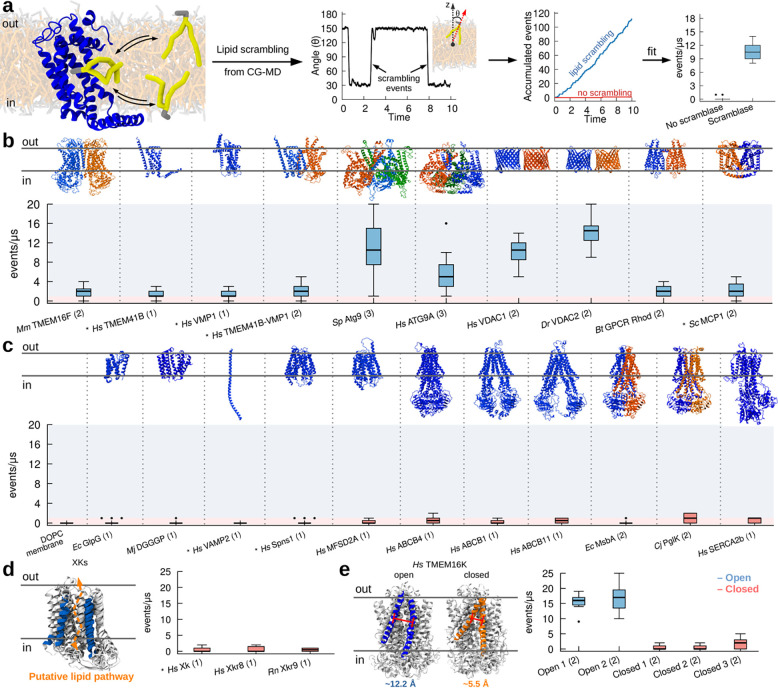
Figure 2. CG simulations recapitulate known activity of lipid scramblases.
a. Protocol used to quantify lipid scrambling in CG-MD simulations. b. CG-MD simulations reproduce lipid scrambling activity by known lipid scramblases of different structure and oligomerization state. c. CG-MD simulations correctly reproduce lack of lipid scrambling activity by proteins that do not have scrambling activity in vitro. d,e. CG-MD simulations recapitulate conformational-dependent lipid scrambling activity by proteins from the XK (d) and TMEM16K (e) families. AlphaFold structures are denoted by the * symbol, oligomerization state is in parenthesis. Light blue and light red shadings indicate scrambling vs non-scrambling activity, respectively. The cut-off used was 1 events/μs.

