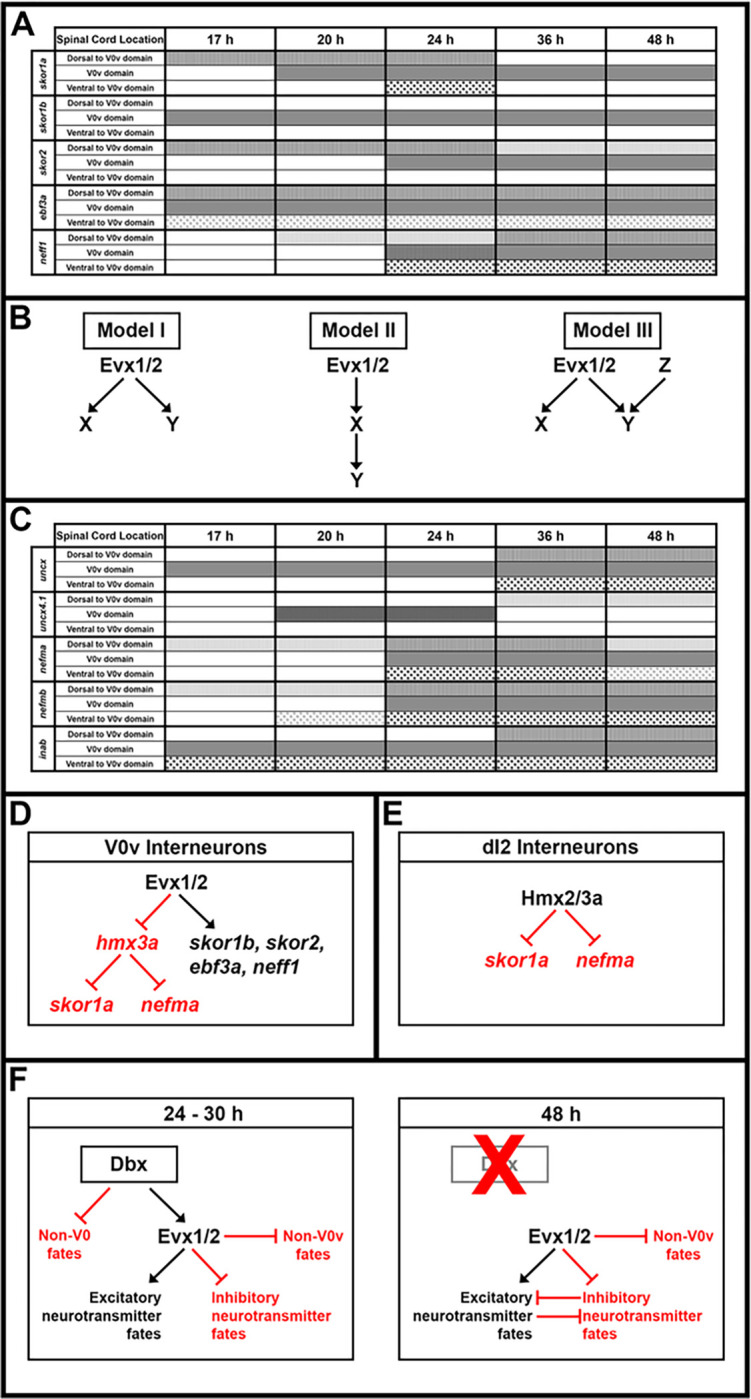
Figure 13. Possible GRNs Downstream of Evx1/2 in V0v Spinal Interneurons.

(A) Schematic summary of temporal expression profiles of skor1a (row 1), skor1b (row 2), skor2 (row 3), ebf3a (row 4) and neff1 (row 5) in the zebrafish spinal cord at 17 h (column 2), 20 h (column 3), 24 h (column 4), 36 h (column 5) and 48 h (column 6) (for in situ hybridization data, please see Fig. 2F–Y, AT–AX). Column 1 lists the location of the expression in the spinal cord. Strong expression in the V0v domain is shown in solid gray. Weak expression in the V0v domain is shown in dark cross-hatching. Expression dorsal to the V0v domain is depicted by either dark (strong expression) or light grey (weak expression) vertical lines. Expression ventral to the V0v domain is represented by either dark (strong expression) or light grey (weak expression) dots. (B) Possible models that explain the temporal expression profiles of candidate GRN genes downstream of Evx1/2 in V0v spinal interneurons (Fig. 2). Model I shows parallel pathways of activation of genes X and Y downstream of Evx1/2. This model may explain the activation of genes that are expressed at similar times in V0v interneurons. In contrast, genes that are expressed at different times may be explained by at least two different models. Model II shows a hierarchical pathway of gene activation downstream of Evx1/2. Evx1/2 activates gene X and the protein product of X then activates gene Y. In this case gene X will be expressed before gene Y. Finally, Model III shows the parallel activation of gene Y by both Evx1/2 and the protein product of gene Z. In this case gene Y will only be expressed when Evx1/2 and Y are expressed and if Y is expressed later than Evx1/2, genes activated by this method will be expressed later than genes activated just by Evx1/2. For simplicity, in these models, we are showing a single step direct gene activation for each step of the pathway. However, as studies have shown for other spinal cord neurons, it is possible that V0v spinal interneuron fates are not specified directly but rather, via a repression of repression mechanism (e.g. 10, 73, 146, 147–150). (C) Temporal expression profiles of uncx (row 1), uncx4.1 (row 2), nefma (row 3), nefmb (row 4) and inab (row 5) in the zebrafish spinal cord at 17 h (column 2), 20 h (column 3), 24 h (column 4), 36 h (column 5) and 48 h (column 6) (for in situ hybridization data, please see Fig. 2Z–AS, AY–AAC). Column 1 lists the location of the expression in the spinal cord. Strong expression in the V0v domain is shown in solid gray. Weak expression in the V0v domain is shown in dark cross-hatching. Expression dorsal to the V0v domain is depicted by either dark (strong expression) or light grey (weak expression) vertical lines. Expression ventral to the V0v domain is represented by either dark (strong expression) or light grey (weak expression) dots. (D) Our data suggest that Evx1/2 may regulate the expression of skor1a and nefma in V0v spinal interneurons by repressing the expression of hmx3a (shown in red). In contrast, the expression of skor1b, skor2, ebf3a and neff1, although dependent on Evx1/2, is independent of hmx3a. (E) Our data suggest that in excitatory dI2 spinal interneurons, hmx3a might repress the expression of non-dI2 fates by repressing the expression of skor1a and nefma. (F) Possible model that explains our scRNA-seq data for mutant group 3 cells. At 24–30 h, dbx1a and dbx1b expression persists in zebrafish V0v spinal interneurons as they become post-mitotic and start to differentiate. Together, Dbx and Evx1/2 repress non-V0v fates in WT cells. Evx1/2 are also required to specify the excitatory neurotransmitter fates of WT V0v spinal interneurons and repress inhibitory neurotransmitter fates. In the absence of Evx1/2, at 24–30 h, double mutant evx1i232/i232:evx2sa140/sa140 cells switch their neurotransmitter fates from excitatory to inhibitory, but they do not change their V0v identities (their axon trajectories are unchanged and they do not ectopically express En1b)(14). In contrast, by 48 h, dbx1a/b are no longer expressed in V0v spinal interneurons, and Evx1/2 is now needed to maintain V0v cell fates by repressing other inhibitory interneuron and motoneuron fates. Consequently, double mutant cells begin to transfate and adopt inhibitory, non-V0v fates by 48 h.
