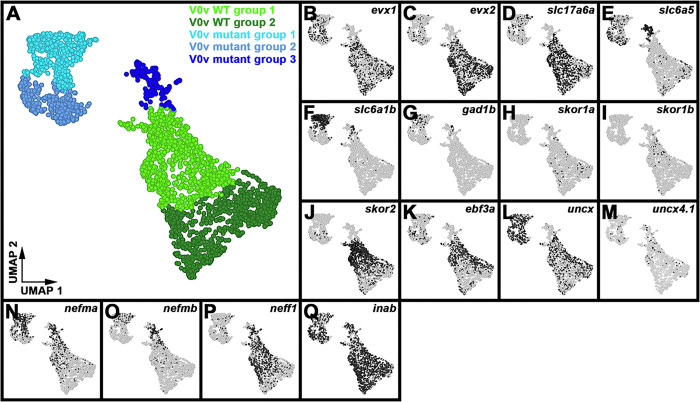
Figure 6. Single-Cell RNA-Seq Analysis of WT and evx1/2 Mutant V0v Interneurons Identifies Five Distinct Clusters of Cells.
(A) UMAP plot of 48 h post-mitotic V0v spinal interneuron single-cell RNA-seq atlas (2860 cells). Cells were obtained from 48 h embryos produced from an incross of evx1i232/+;evx2sa140/+ heterozygous parents homozygous for Tg(evx1:EGFP)SU2. Clusters are color-coded by cell identity: V0v WT group 1 (light green), V0v WT group 2 (dark green), V0v mutant group 1 (turquoise), V0v mutant group 2 (light blue), and V0v mutant group 3 (dark blue). Cell fate assignments were deduced and extrapolated by comparing expression profiles of 48 h single-cell clusters with the molecular phenotypes of V0v spinal interneurons in wild-type and evx1 and evx2 single and double mutant embryos (14). (B-Q) UMAP plots of differential gene expression between cell clusters. Black shows high levels of expression, light grey shows low levels of expression. All expression data have been normalized (see Methods). (B-D) Many of the cells in both WT clusters express (B) evx1 and/or (C) evx2, as well as the glutamatergic marker (D) slc17a6a. (B-G) evx1, evx2 and slc17a6a are all detected in fewer cells in mutant groups 1 and 2 and hardly any cells in mutant group 3. Many cells in the mutant clusters upregulate inhibitory markers, including (E) slc6a5, (F) slc6a1b, and (G) gad1b. (H) skor1a and (I) skor1b are not detected in many cells in this data set. (H) skor1a is expressed in a few WT group 1 and 2 cells, as well as a couple of mutant group 3 cells and a mutant group 1 cell. (I) skor1b is predominantly detected in a few WT group 1 cells. (J) In contrast, skor2 is expressed at high levels in most V0v WT group 1 cells, and it is also detected in multiple WT group 2 cells and a small number of mutant group 2 cells. (K) ebf3a has a similar expression profile to skor2, except that its expression is also detected in a few mutant group 1 cells and slightly more mutant group 2 cells. (L) uncx is expressed by many cells in all the clusters except the mutant group 3 cluster. The highest proportions of uncx-expressing cells are in mutant groups 1 and 2 (56.58% (245/433) and 58.81% (217/369) respectively, compared to 42.44% (396/933) WT group 1 cells, 32.79% (303/924) WT group 2 cells, and 12.44% (25/201) mutant group 3 cells). (M) In contrast to uncx, uncx4.1 is only expressed by several cells in each of the clusters. (N-Q) Of the neuronal intermediate filament genes, inab is expressed in all five clusters, but it is detected in slightly fewer cells in the mutant clusters. (N-O) nefma and nefmb are predominantly expressed by cells in WT and mutant group 1 clusters and the mutant group 3 cluster. (P) neff1 is detected in most WT group 1 cells, some WT group 2 cells, several mutant group 3 cells, but hardly any mutant group 1 or 2 cells

