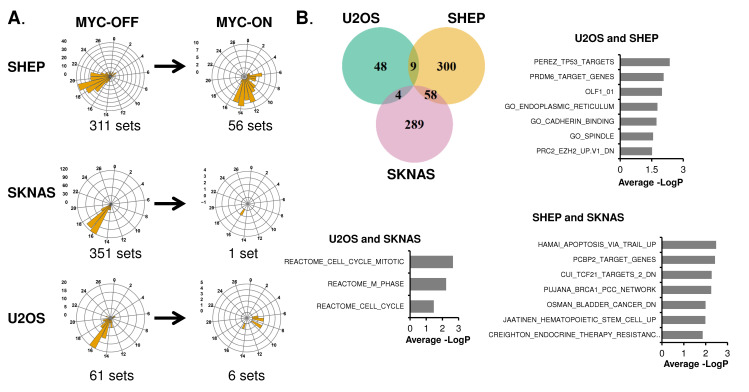
Fig 3. Oncogenic MYC shifts the identify of oscillating transcriptional programs.
A. Oscillatory genes in SHEP N-MYC-ER, SKNAS-N-MYC-ER or U2OS MYC-ER were analyzed with Phase Set Enrichment Analysis (PSEA) for oscillatory pathway enrichment, with a period of 20–28 hours and q-value (vs. background)< 0.2 and p-value (vs. background) <0.1 deemed significant. Oscillatory pathways were binned by hour and plotted on a polar histogram, which is a circular histogram that accurately displays a repeating circadian scale on the X-axis. The Y-axis scale for each histogram is on the left side. MYC-OFF significant pathways are shown, and the same pathways are also plotted for MYC-ON. B. Overlap of oscillatory programs in MYC-OFF are shown by Venn diagram, and identity of oscillatory programs are plotted by average of–LogP from each cell line of overlap. The most highly significant pathways (up to 10) for each overlap are shown.

