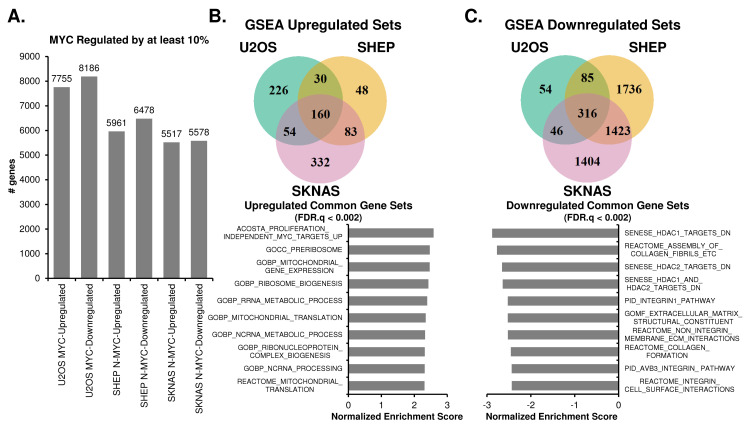
Fig 4. MYC upregulates biosynthetic and metabolic processes and suppresses cell adhesion processes across cancer cell lines.
A. Differential expression analysis, using DeSeq2, was performed on MYC-ON vs MYC-OFF for SHEP N-MYC-ER, SKNAS-N-MYC-ER or U2OS MYC-ER, with p.adj < 0.05 deemed significant. Genes that were up- or down-regulated in MYC-ON by at least 10% are shown. B, C. Gene Set Enrichment Analysis (GSEA) was performed on genes up- or down-regulated by at least 10% in each cell line using GSEA Pre-Ranked, with gene sets with FDR q-val < 0.25 deemed significant. Venn diagrams of overlapping gene sets from MYC-ON upregulated (B) and MYC-ON downregulated processes (C) are shown, and the most highly significant pathways (up to 10) for each overlap are shown, ranked by Normalized Enrichment Score. For all graphed pathways, FDR.Q < 0.002.

