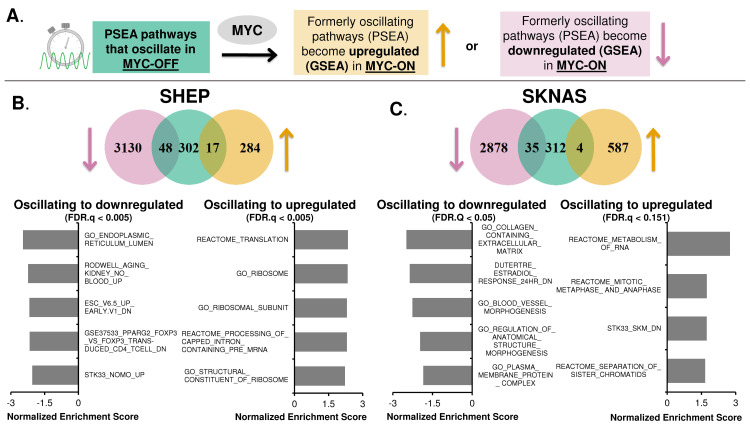
Fig 5. Oncogenic MYC shifts oscillatory gene expression to static non-oscillatory regulation.
A. Illustration of workflow to identify pathways that lose oscillation when MYC is activated (by PSEA), and which of these pathways become up- or down-regulated by MYC (using GSEA). B, C. Venn diagram from SHEP N-N-MYC-ER (B) and SKNAS N-MYC-ER (C) of pathways (identified by PSEA) that were circadian in MYC-OFF (center, green), and lost oscillation and became either downregulated (left, pink) or upregulated (right, tan) in MYC-ON (identified by GSEA). The most highly significant downregulated and upregulated pathways that lost oscillation from SHEP (B) and SKNAS (C) are shown below each Venn diagram, as ranked by Normalized Enrichment Score from GSEA. For all data shown, p value is < 0.01 and FDR.Q value is indicated on the graph.

