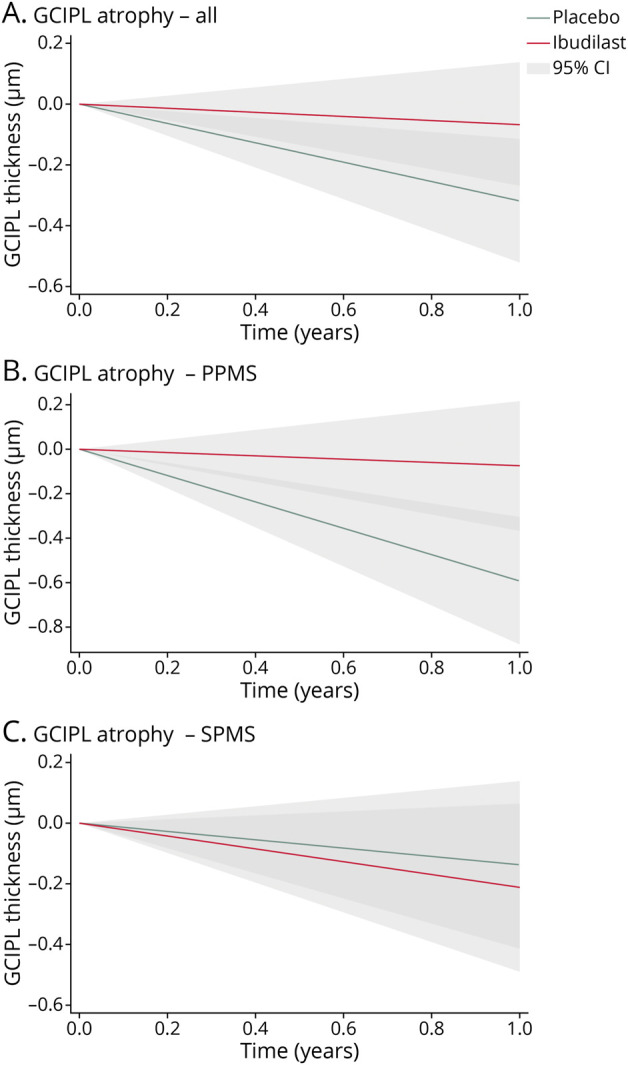
Figure 1. Change in GCIPL Thickness Over Time, by Treatment Group and PMS Subgroup, in the SPRINT-MS Clinical Trial.

Lines represent estimated annual rates of ganglion cell + inner plexiform layer (GCIPL) change for the entire population (A), as well as the primary progressive multiple sclerosis (PPMS, B) and secondary progressive multiple sclerosis (SPMS, C) subgroups (placebo [green] and ibudilast [red] lines). Shaded areas represent the 95% confidence intervals (light gray or dark gray for overlapping confidence intervals). Rates were estimated using mixed-effects models with random intercepts and adjusted for age, sex, subtype, and disease duration. The lines are shown originating at 0 μm to show annual change from baseline. The x axis ranges from 0 to 1 to represent the estimated change over the course of 1 year.
