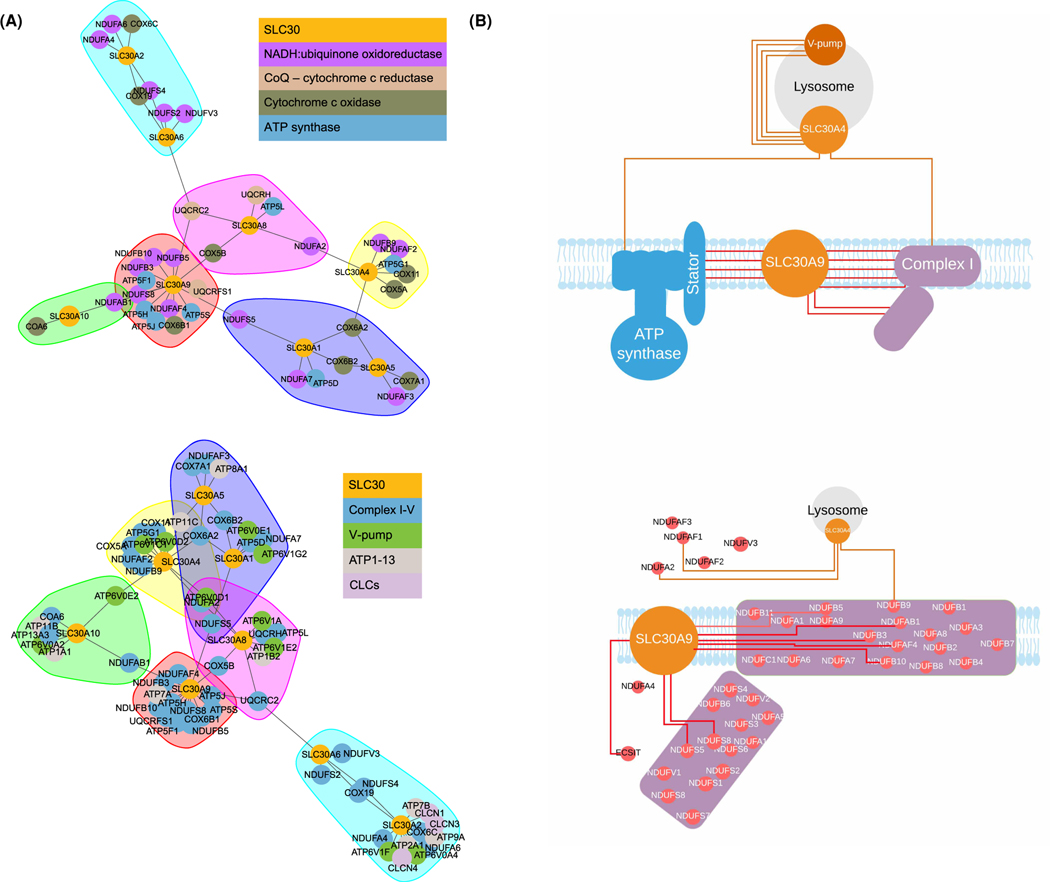
Figure 4. SLC30 evolutionary network clusters and diagrams of SLC30A9 interaction with mitochondrial components.
(A) Clustering of SLC30A transporters with mitochondrial proteins. Clusters highlighted with arbitrary colors indicate communities identified during clustering. Top: SLC30A9 shows robust clustering with numerous mitochondria-related proteins, including NDUF and ATP proteins. Note the cluster including SLC30A9 (in red) with many NADH proteins (purple dots) and ATP synthase proteins (blue dots). Bottom: Clustering using an expanded geneset shows distinctive clustering of SLC30A9 (red cluster) with numerous mitochondria complex I–V proteins (blue circles). (B) Wire diagram comparing ERC-positive interactions (at R > 0.3) between SLC30A9 and the mitochondrial OxPhos components. SLC30A4 is shown as a control.

