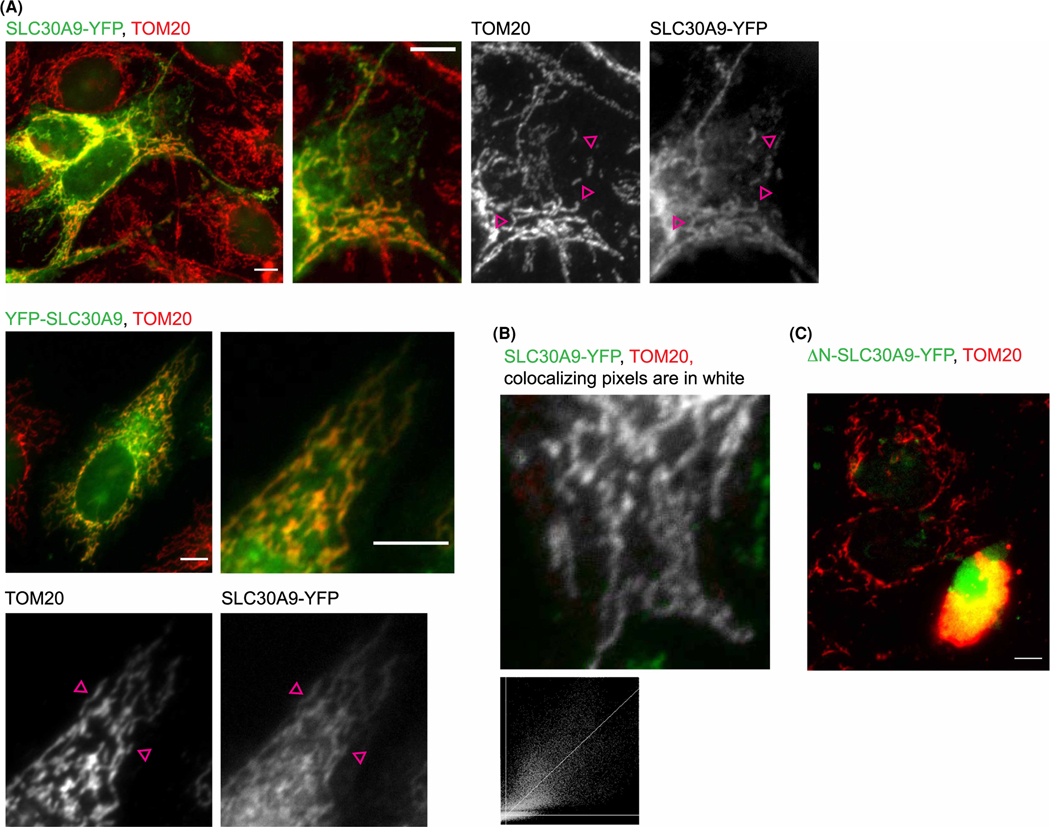
Figure 5. SLC30A9 localization.
(A) Widefield fluorescence image of N-terminal (top) and C-terminal (bottom) YFP fusion of human SLC30A9 (green) expressed in HeLa cells and co-stained with antibodies against TOM20 (red). In addition, zoom-in images are shown for clarity. Pink arrows point to examples of overlapping stains. Scale bars are 10 μm. (B) An example of colocalization analysis of SLC30A9 and TOM20 obtained using the Colocalization threshold Plugin of FIJI. Histogram below shows linear regression of intensities of the overlapping pixels in the red and green channels. (C) Evidence of cell death in cells overexpressing N-terminal deletion of SLC30A9. A representative widefiled image of HeLa cells transfected with GFP-tagged N-terminal deletion construct of human SLC30A9 stained as above. Note the swelling and detachment of the transfected cell as well as swelling and compacting at the nucleus of the mitochondria, indicating cell death.

