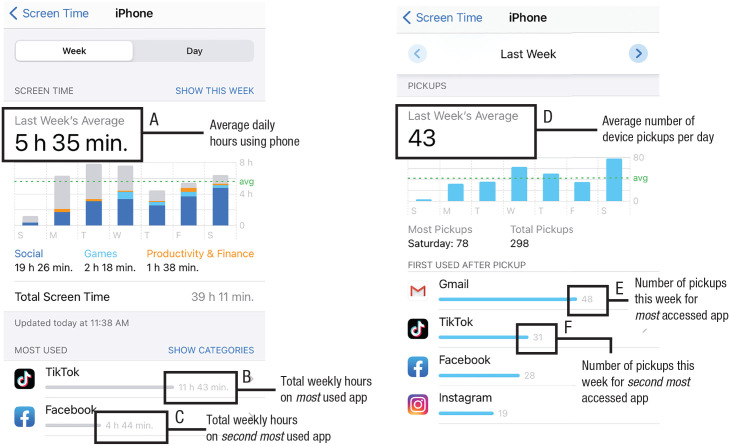
Fig. 1.
Sample screenshots from the iPhone Screen Time app showing overall daily phone hours (a), daily hours spent on the most frequently used app (b) and second-most frequently used app (c), overall daily phone pickups (i.e., instances of the user interacting with an app on their device after it was sitting idle; d), and the number of times per day the smartphone was picked up to access the most frequently used app (e) and second-most frequently used app (f). Weekly totals were converted to daily averages.

