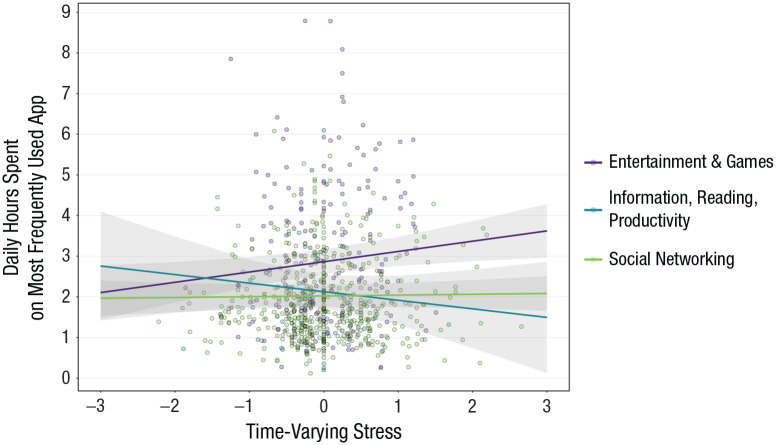
Fig. 4.
Time-varying associations between self-reported stress and daily hours students spent on their most frequently used app (categorized as social networking, entertainment and games, or information, reading, and productivity). Lines represent model-implied simple slopes for each category of app, pictured with 95% confidence bands.

