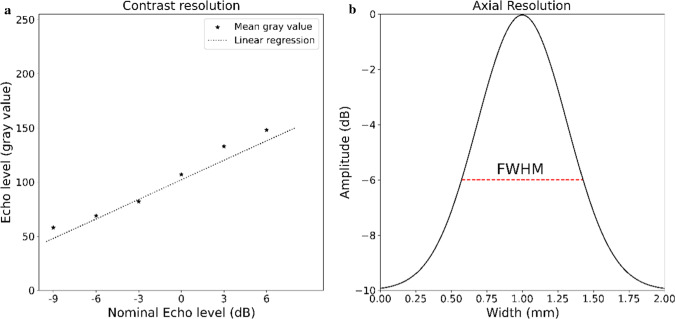
Fig. 2.
a (left): An example of mean gray values plotted against the nominal echo levels. The dotted line represents a linear regression of the gray values. The gradient of the linear regression is the contrast resolution. b (right): An example of how FWHM is measured. The peak of the curve represents a small marker. −6 dB is considered half the level of the maximum signal of the peak. The red striped line at −6 dB represents the full width of the peak (FWHM)

