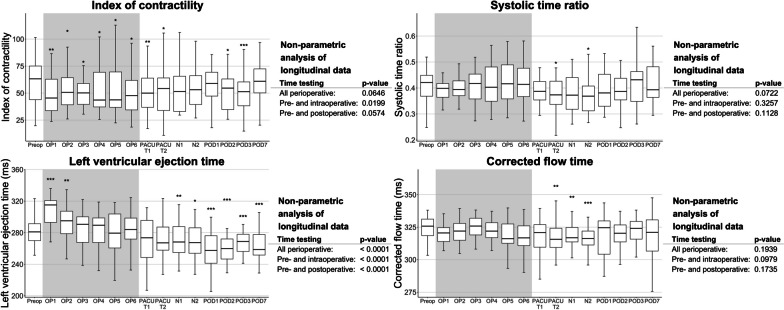
Fig. 3.
Perioperative time course of selected EC parameters (index of contractility, systolic time ratio, left ventricular ejection time, corrected flow time). Data are shown as boxplots over time from the preoperative baseline up to the postoperative day 7 (POD7). Asterisks indicate (*) p < 0.05, (**) p < 0.01, and (***) p < 0.001 of the respective timepoint versus the preoperative baseline values according to the non-parametric analysis for longitudinal data. The non-parametric analyses of longitudinal data for the parameters over the perioperative period are indicated on the right-hand side, respectively. BL baseline, N1-2 timepoints 1–2 during the first postoperative night, OP1-6 timepoints 1–6 in surgery, PACU T1 postanaesthesia care unit timepoint 1, PACU T2 postanaesthesia care unit timepoint 2, POD1-3/7 postoperative days 1–3/7

