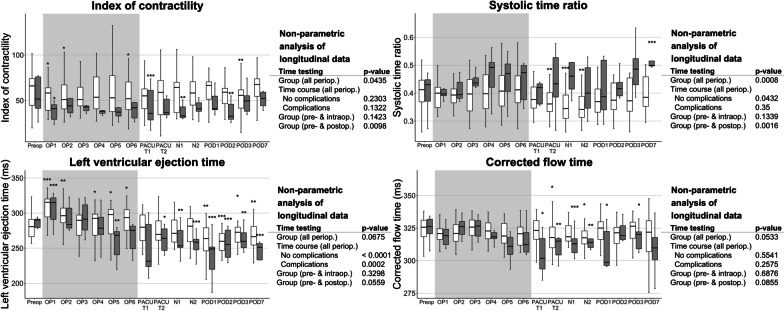
Fig. 5.
Perioperative longitudinal data of selected EC parameters (index of contractility, systolic time ratio, left ventricular ejection time, corrected flow time), grouped by the incidence of a complication according to Clavien–Dindo higher than IIIa (
 no complications,
 complications). Data are shown as boxplots over time from the preoperative baseline up to the postoperative day 7 (POD7). Asterisks indicate (*) p < 0.05, (**) p < 0.01, and (***) p < 0.001 of the respective timepoint versus the preoperative baseline values according to the non-parametric analysis for longitudinal data. The non-parametric analyses of longitudinal data for the parameters over the perioperative period are indicated on the right-hand side, respectively. BL baseline, N1-2 timepoints 1–2 during the first postoperative night, OP1-6 timepoints 1–6 in surgery, PACU T1 postanaesthesia care unit timepoint 1, PACU T2 postanaesthesia care unit timepoint 2, POD1-3/7 postoperative days 1–3/7

