Fig. 7.

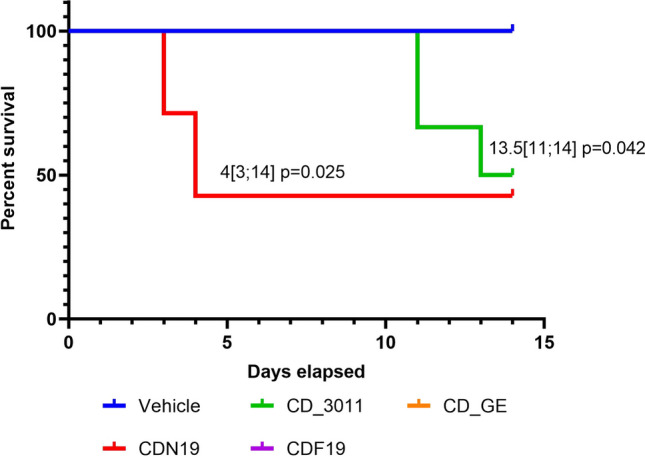
Kaplan–Meier survival plots for mice treated with CDN19 and CD_3011 (the groups where mortality was observed) compared to Vehicle-treated ones served as a control. Medians survival with respective p values are provided

Kaplan–Meier survival plots for mice treated with CDN19 and CD_3011 (the groups where mortality was observed) compared to Vehicle-treated ones served as a control. Medians survival with respective p values are provided