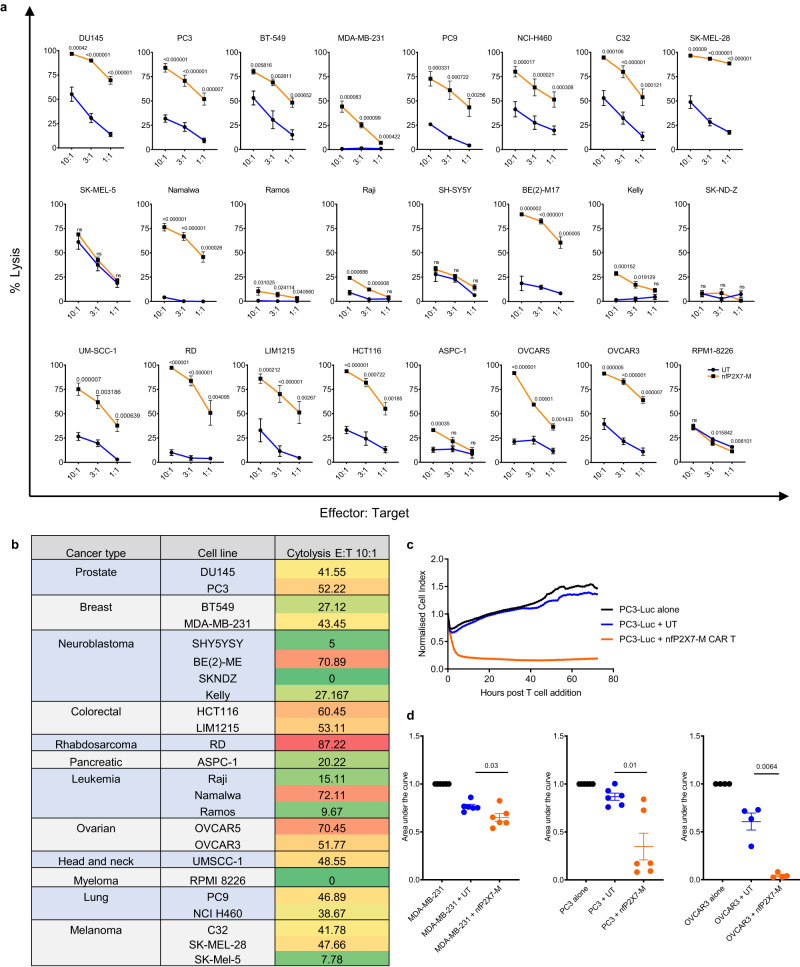
Fig. 3. NfP2X7-CAR-T cells exhibit broad-spectrum cytotoxicity against a diverse range of cancer cells.
a Cytotoxicity of target cells by CD3+ nfP2X7-M-CAR-T cells compared with donor-matched untransduced (UT) cells generated in parallel. Target cell lines include: DU145 (prostate cancer), PC3 (prostate cancer), BT-549 (breast cancer), MDA-MB-231 (breast cancer), PC9 (lung cancer), NC1-H460 (lung cancer), C32 (melanoma), Sk-Mel-28 (melanoma), Sk-Mel-5 (melanoma), Namalwa (lymphoma), Ramos (lymphoma), Raji (lymphoma), SH-SY5Y (neuroblastoma), Be(2)-M17 (neuroblastoma), Kelly (neuroblastoma), SK-ND-Z (neuroblastoma), UM-SCC-1 (head and neck carcinoma), RD (rhabdomyosarcoma), LIM1215 (colorectal cancer), HCT116 (colorectal cancer), AsPC-1 (pancreatic cancer), OVCAR5 (ovarian cancer), OVCAR3 (ovarian cancer), RPMI-8226 (myeloma). CAR-T cells were co-cultured with target cancer cell lines at effector:target E:T ratios of 10:1, 3:1 and 1:1 for 16 h. Specific cytotoxicity was measured using a BrightGlo luciferase-based cytotoxicity assay system; paired T test comparing the nfP2X7-M CAR-T with CD3+ UT at the indicated time points. Pooled data from three independent experiments. Statistical significance was evaluated by paired T test. Exact p values on the graph, ns: non-significant. b Table listing cancer types and cancer cell lines tested. Cytotoxicity values at E:T ratio of 10:1, with cytotoxicity values from untransduced control T cells subtracted. c Representative graph showing changes in normalised cell index over time (in hours) for the human prostate cancer cell line PC3 when untreated (black) or treated with either untransduced T cells (UT) (dark blue) or nfP2X7-M CAR T cells (orange). Black vertical line reflects time point at which T cells were added. d The area under the curves were measured and normalised to the cancer cell alone control. Data represents mean ± SEM. Data is pooled from independent experiments for MDA-MB-231 (n = 6), PC3 (n = 6) and OVCAR3 (n = 4) target cell lines, where each dot represents an experiment conducted with T cells from a separate donor. Statistical significance was evaluated by paired T test. Exact p values on the graph, ns: non-significant.

