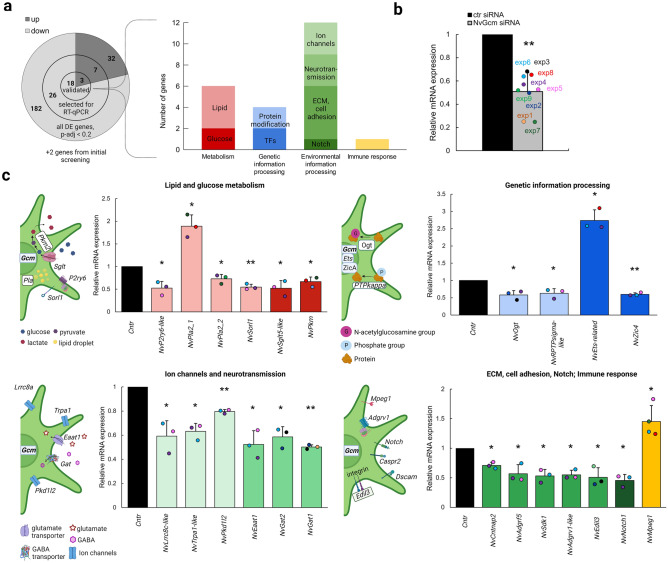
Figure 3.
RT-qPCR validation of DE genes in NvGcm-depleted larvae. (a) Total number of DE genes identified in RNA-seq at p-adj < 0.2, numbers of DE genes selected for RT-qPCR validation, and numbers of genes validated by RT-qPCR. Functional classification of RT-qPCR validated DE genes (b) NvGcm KD efficiency in experimental batches used for RT-qPCR validation. Each experiment is color-coded. (c) Relative mRNA expression of validated candidate genes in NvGcm-depleted larvae compared to controls. Some up-regulated DE genes (NvPla2.1, NvEts-related, and NvMpeg1) are also shown. Each data point is color-coded and corresponds to the experiment in b. Simplified cartoons to the left of the bar graphs in c demonstrate cellular processes in which validated candidate genes are involved.

