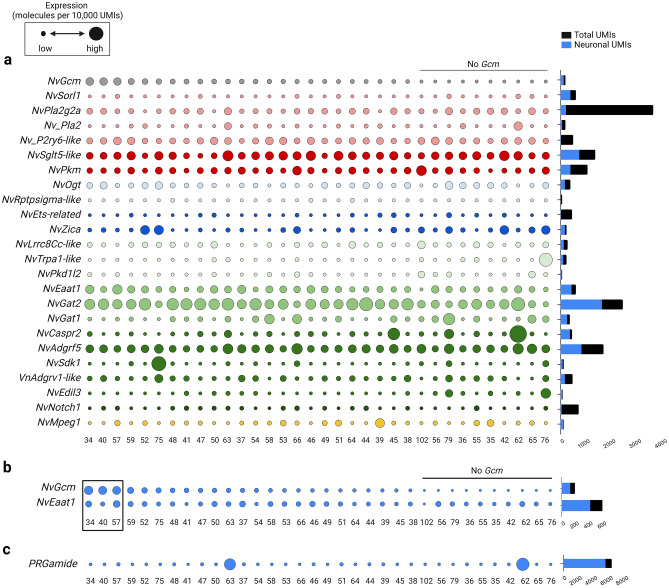
Figure 4.
Genetic signature of NvGcm-expressing cells. Gene expression is based on scRNA-seq data (10). The dot plot shows normalized expression values (molecules per 10,000 UMIs) scaled by the gene. Smallest and largest dots represent the lowest and highest expression, respectively. Cell clusters are organized left to right in descending order of NvGcm expression. (a) Expression of NvGcm and its candidate target genes across neuronal cell clusters in adult N. vectensis. Dots are colored in accordance with gene functional groups as presented in Fig. 3. (b) Expression of NvGcm and NvEaat1 across adult neuronal cell clusters. Cell clusters with the highest expression of NvGcm are framed (c) Expression of PRGamide neuropeptide gene across adult neuronal cell clusters.

