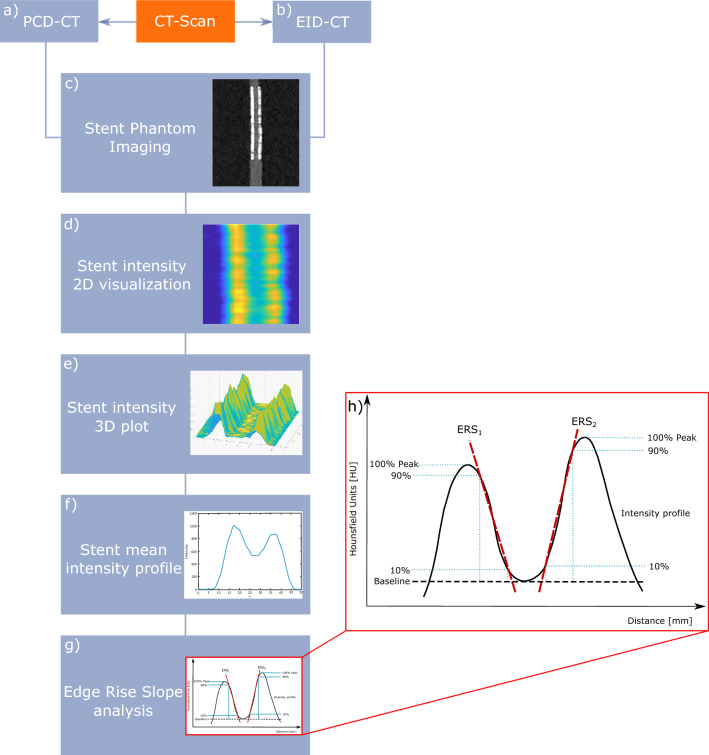
Figure 2.
Overview of the quantitative image analysis pipeline using an in-house developed MATLAB script. All stents were scanned on (a) PCD-CT and (b) EID-CT. (c) CT DICOM dataset of every stent was reconstructed, (d) 2D intensity profiles were calculated for each stent, (e) and plotted as 3D intensity plot across the entire length of the stent, (f) mean intensity profile of the 3D intensity profile, (g) automatic estimation of the ERS of every stent and kernel, (h) mean intensity-profile curve of the stent with the edge rise slope a HU of 10% and 90% of the maximum CT attenuation are shown. PCD-CT, Photon-counting detector CT; EID-CT, Energy integrating detector CT; DICOM, Digital imaging and communications in medicine; ERS, Edge rise slope; HU, Hounsfield Units

