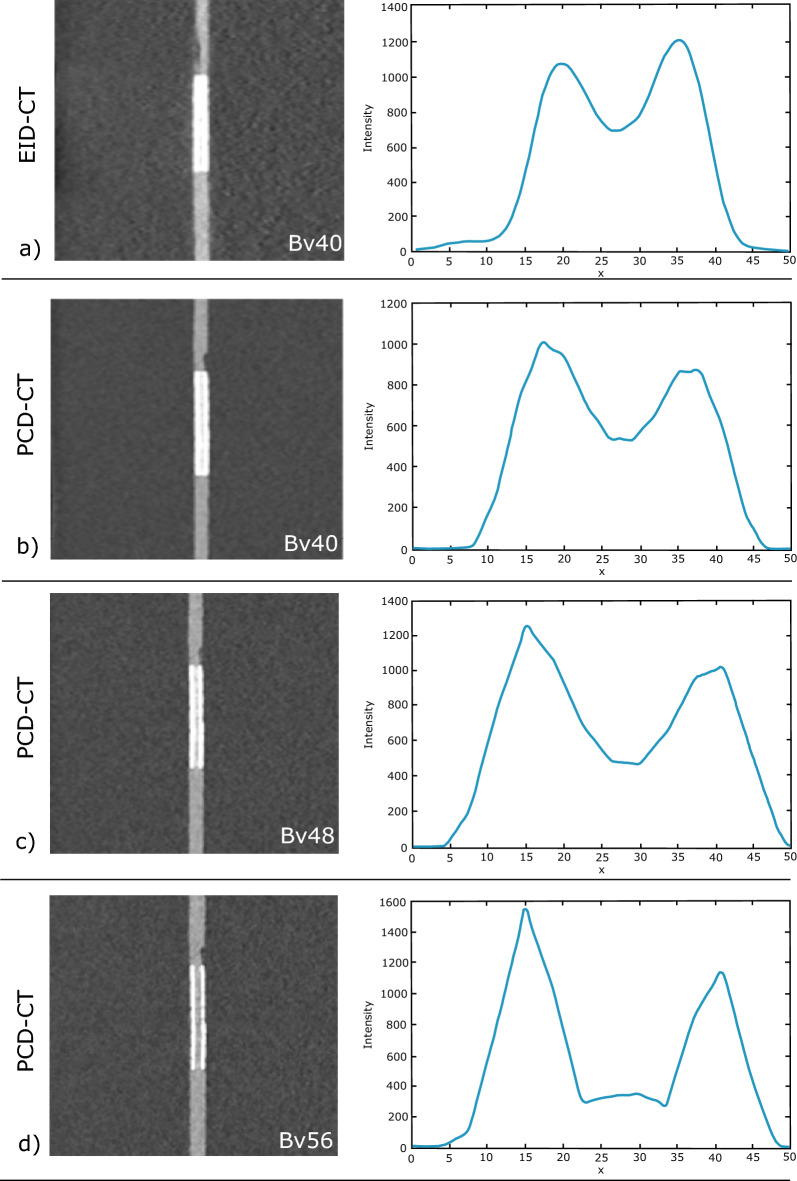
Figure 5.
Image example of a 3 mm coronary artery stent (Everolimus-Eluting Platinum Chromium). Gray images depict the stent in EID-CT and three different kernel strengths of PCD-CT with the corresponding mean intensity profiles of the edge rise slope analysis. Subjective as well as objective analyses revealed higher image sharpness and reduced blooming with increasing kernel strength. PCD-CT, Photon-counting detector CT; EID-CT, Energy integrating detector CT.

