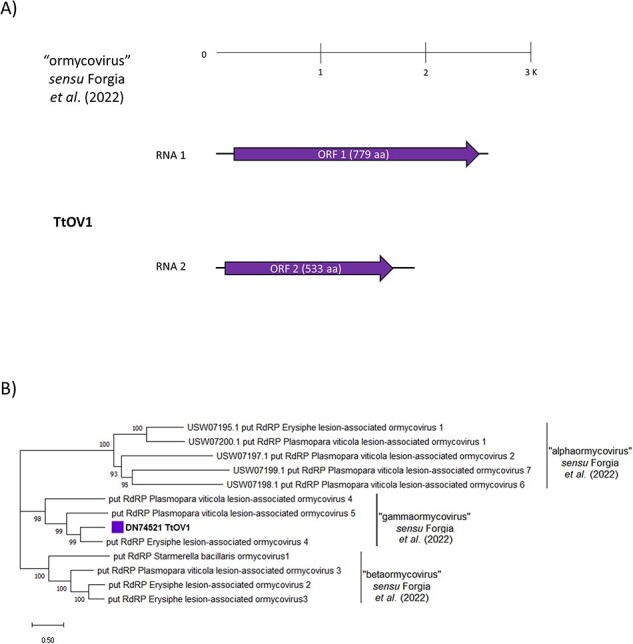
Figure 8.

(A) The genome organization of the putative ‘ormycovirus’ TtOMV1; top ruler indicates length in kb. Solid lines represent ORFs which returned at least one BlastP hit, while dotted lines represent ORFans. (B) The ‘Ormycovirus’ phylogenetic tree as computed by the IQ-TREE stochastic algorithm, which infers phylogenetic trees by maximum likelihood. Model of substitution: VT + F + G4. Consensus tree is constructed from 1,000 bootstrap trees. Log-likelihood of consensus tree: −24,861.9845. Percentage bootstrap values are displayed at the nodes. Distinct colors indicate specific viruses in different sub-groups.
