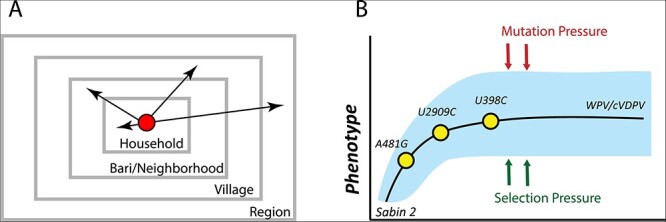
Figure 1.

Sabin 2 transmission and reversion schematic. (A) A multiscale epidemiology model. To simulate household and community member–specific transmission rates, individuals are organized into a series of nested, demographic scales defined by households, baris/neighborhoods, and villages that together define the greater region. The bari is an intergenerational living arrangement of closely related individuals specific to Matlab, the study population the epidemiology model was calibrated to. Conceptually, it is analogous to a neighborhood. Infectious contacts occur at different rates to individuals in each of these demographic scales. During each infectious contact, infected individuals transmit a viral dose that depends on their individual viral shedding concentration and the average fecal–oral dose per contact in the population. (B) Sabin 2 reversion model. Sabin 2 evolution is modeled as a population of competing viral lineages whose average phenotypic end-state distribution is identical to that of WPV. The reversion is driven by the acquisition of three gatekeeper mutations (A481G, U2909C, and U398C) and the acquisition of deleterious mutations introduced through mutation and purged through selection.
