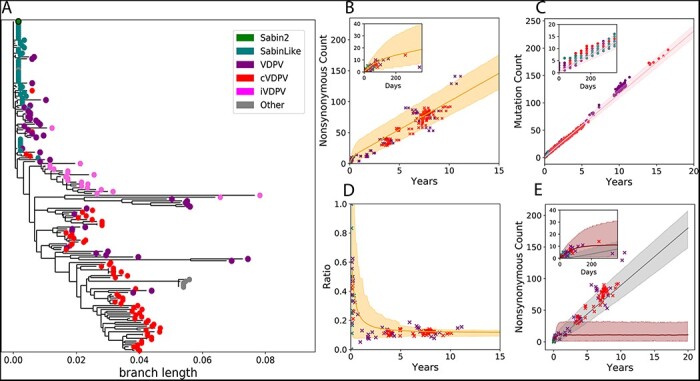
Figure 2.

Molecular evolution. (A) A phylogenetic tree based on the nonsynonymous mutations from the 177 whole genome sequences used to calibrate our model. Samples were categorized as Sabin 2, Sabin-like, VDPV isolated from immunocompromised individuals (iVDPV), VDPV, and cVDPV2, as classified in the original publications associated with the sequences. The other category includes the Lansing and MEF-1 laboratory strains as well as several engineered strains derived from the Lansing strain. Samples classified as iVDPV or ‘other’ were excluded from the model calibration. The tree was generated by defining Sabin 2 as the root to emphasize convergent evolution across outbreaks at the amino acid level. (B) Simulated genome-wide nonsynonymous mutation accumulation over time (shading, orange) compared against those observed in the Sabin 2, Sabin-like, VDPV, and cVDPV2 whole genome sequences. (C) Simulated (shading, pink) VP1 mutation (synonymous and nonsynonymous) accumulation over time compared against the mutation counts observed in 1,643 VP1 segments. (D) The ratio of nonsynonymous and synonymous mutations throughout the genome over time. (E) Simulated genome-wide nonsynonymous counts partitioned into deleterious (dark shading, brown) and neutral (light shading, gray). Across all figures, the solid line is the mean simulation outcome, and the shaded area marks the boundaries of the middle 95 per cent. Empirical data are represented by points and colored according to the legend in A. Time was calculated by dividing the number of synonymous mutations per sample by the synonymous substitution rate (3.16E-05 substitutions/bp/day). The insets in B, C, and E are close-ups of the first year of evolution to better show short-term evolution dynamics.
