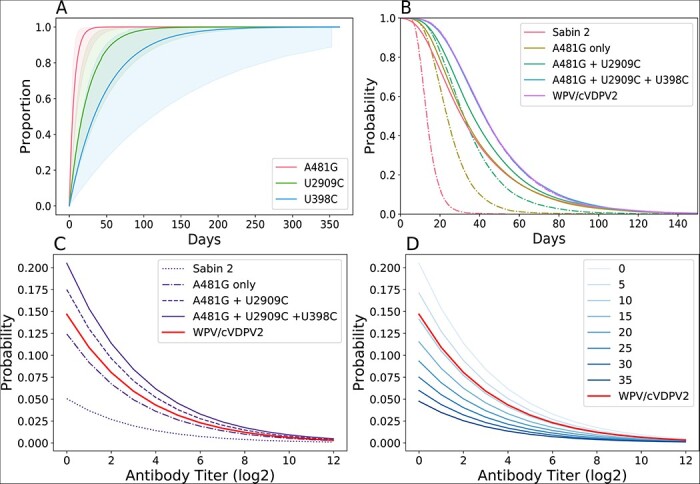
Figure 3.

Phenotypic evolution. (A) Cumulative density reversion probability functions for the three gatekeeper mutations. The solid line is the mean and the shading is the 95 per cent confidence interval. (B) The shedding duration profile of immunologically naive individuals infected with Sabin 2, WPV/cVDPV2, and three different intermediate viral genotypes. The dotted lines are the shedding durations of the initial viral genotype, assuming no further reversion or evolution. The solid lines are the shedding durations of each viral genotype, where the reversion of new gatekeeper mutations extends the current shedding duration. Nonsynonymous mutations have no discernible phenotypic effect with regard to shedding duration. (C and D) Viral infectiousness. Each curve shows the strain-specific probability of infection, given a single CCID50 dose plotted against immunity. (C) Shows infectiousness following the acquisition of each of the three gatekeeper mutations. (D) Emphasizes the role of deleterious nonsynonymous mutations and shows the infection probability of different viral genotypes with all gatekeeper mutations and deleterious nonsynonymous mutation counts ranging from 0 to 35.
