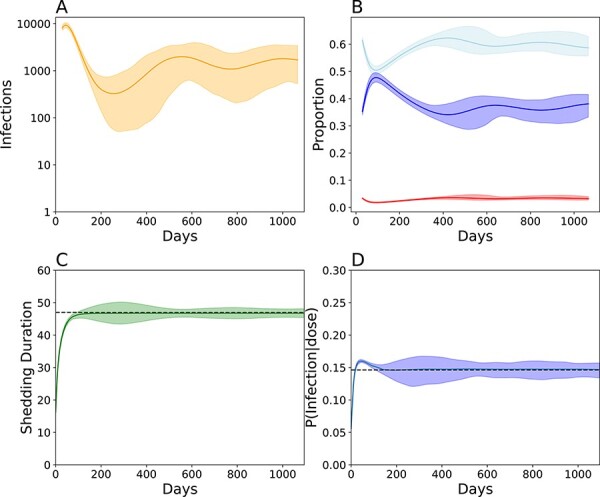
Figure 4.

Evo-epidemiological dynamics following a mass vaccination campaign targeting 10 per cent of children under 5, five years post-vaccination cessation in Matlab, Bangladesh. Simulations assume ten times the fecal–oral dose in Matlab to ensure stable transmission and conditioned on stable, endemic transmission for at least 3 years. (A) The total number of infected individuals over time. The solid line indicates the smoothed average and the shading indicates the boundaries of the middle 95 per cent from 600 simulations. (B) Smoothed longitudinal immune profiles for individuals with low immunity (red, antibody titer <8), intermediate immunity (light blue, antibody titer >8 and <256), and high immunity (dark blue, antibody titer >256). (C) Smoothed shedding duration evolution in naive individuals over time. (D) Smoothed viral infectiousness evolution over time. Note the wider confidence intervals in surrounding shedding duration and shedding duration between Days 200 and 600 resulting from strong genetic drift. For B–D, the solid line denotes the simulated average and the boundaries denote the 95 per cent confidence interval around the mean. For C and D, the dashed black line indicates the average WPV phenotype.
