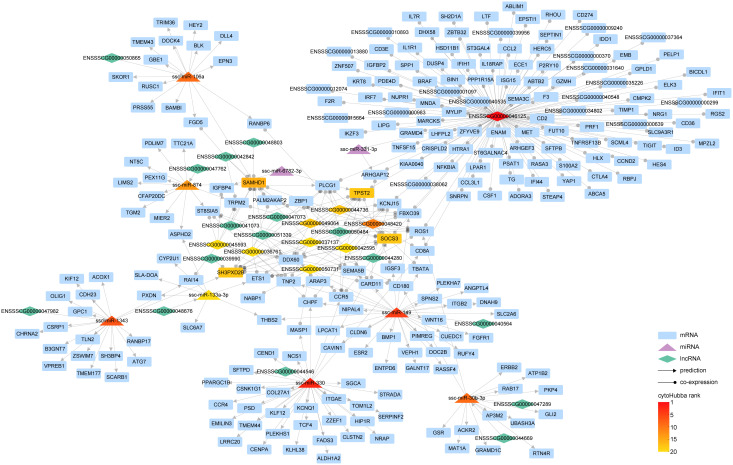
Figure 6.
The interaction network of lncRNA-miRNA-mRNA. Within the graph, various entities are represented by distinct geometric shapes: mRNAs by rectangles, miRNAs by triangles, and lncRNAs by diamonds. Relationships derived from predictive analysis are denoted by lines marked with arrowheads, while co-expression relationships are illustrated by lines equipped with circular indicators. The gradation of color corresponds to the hierarchical positioning of different RNA types as determined by cytoHubba.

