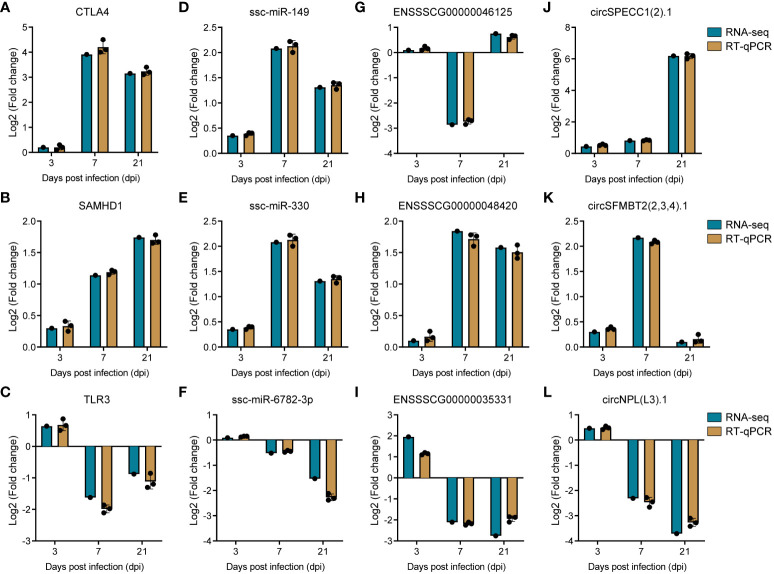
Figure 8.
Validation of RNA sequencing data by RT-qPCR. (A–C) Barplots of fold change of mRNA CTLA4, SAMHD1 and TLR3. (D–F) Barplots of fold change of miRNA ssc-miR-149, ssc-miR-330, and ssc-miR-6782-3p. (G–I) Barplots of fold change of lncRNA ENSSSCG00000046125, ENSSSCG00000048420, and ENSSSCG00000035331. (J–L) Barplots of fold change of circRNA circSPECC1 (2).1, circSFMBT1 (2,3,4).1, and circNPL(L3).1.

