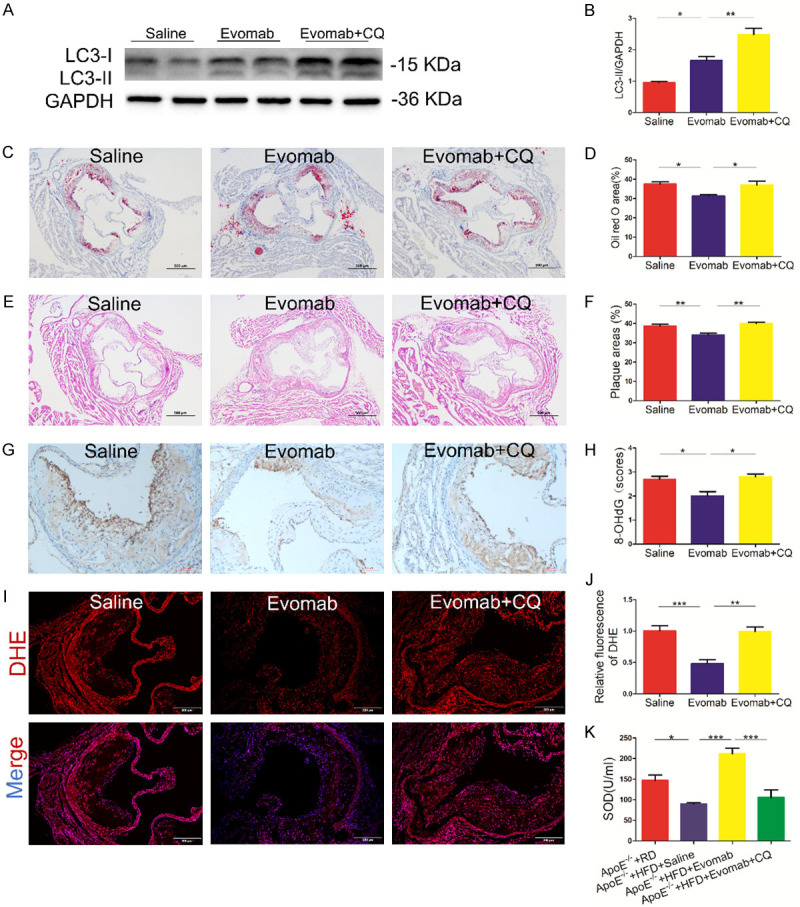
Figure 4.

Impaired autophagy attenuated the protective effects of evolocumab against oxidative stress and plaque lesions in vivo. A-J. Apolipoprotein E (ApoE)-/- mice fed a high-fat diet (HFD) for 8 weeks were treated with saline, evolocumab (Evomab), and Evomab plus chloroquine (CQ) for another 8 weeks. Regular diet (RD)-fed ApoE-/- mice were used as the control group. A, B. Western blot analysis of microtubule-associated protein 1 light chain 3 (LC3) in the aortic vascular tissue of ApoE-/- mice in the saline, Evomab, and Evomab plus CQ groups. Quantification of relative protein levels (n = 4 mice per group). C, D. Representative oil red O staining of the aortic root lesions of ApoE-/- mice in each group (scale bar = 500 μm). Quantification of lipid deposition area (n = 5 mice per group). E, F. Hematoxylin and eosin staining of the aortic root sections of ApoE-/- mice in three groups (scale bar = 500 μm). Quantification of plaque lesions (n = 5 mice per group). G, H. Immunohistochemical analysis of 8-hydroxy-2’-deoxyguanosine (8-OHdG) expression in the aortic root plaques of ApoE-/- mice in three groups (scale bar = 100 μm). Quantification of 8-OHdG staining (n = 5 mice per group). I, J. Dihydroethidium (DHE) staining for detecting reactive oxygen species (ROS) in the aortic root plaques of ApoE-/- mice in three groups (DAPI: nuclei; scale bar = 200 μm). Quantification of DHE relative fluorescent intensity (n = 5 mice per group). K. Quantification of the serum levels of superoxide dismutase (SOD) by colorimetric assay (n = 6-8 mice per group). The data are presented as the mean ± standard error of the mean (SEM). *P < 0.05; **P < 0.05; ***P < 0.001.
