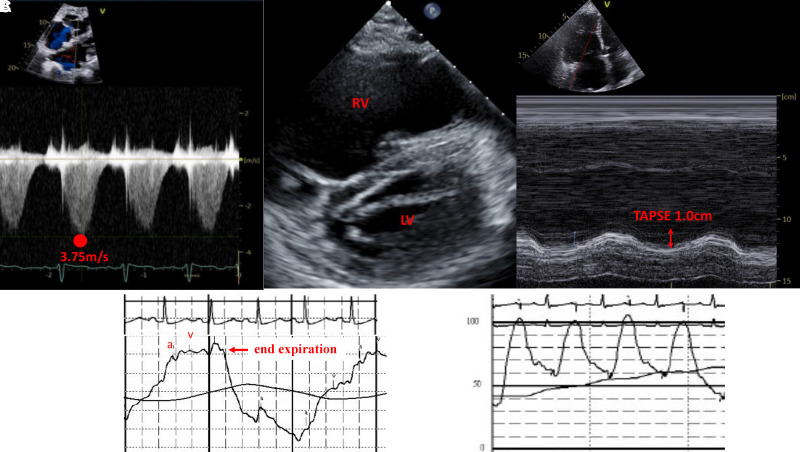
Figure 2.
Echocardiographic features supportive of pulmonary hypertension and characteristic confirmatory right heart catheterization tracings. (A) The velocity of the tricuspid regurgitant jet (3.75 m/s), measured with continuous‐wave Doppler imaging in the apical four‐chamber view, is used to calculate systolic pulmonary artery pressure (sPAP); sPAP = 4V2 + CVP. (B) In the short‐axis two‐chamber view, the interventricular septum imaged at end systole is flat (“D sign”), indicative of RV volume and pressure overload. (C) TAPSE, a measure of right ventricular function, represents the apical displacement of the tricuspid annulus between diastole and systole measured by M‐mode echocardiography. (D) Typical pulmonary artery wedge pressure tracing at end-expiration with black line representing average pressure over the respiratory cycle which can be reported in cases with significant respiratory variation, as opposed to typical end-expiration; a-wave and v-wave are noted in red, with the v-wave falling outside the T-wave on an associated ECG. (E) Example of an optimal pulmonary artery pressure waveform with preserved dichroic notch. 4V2 = V is the peak velocity (m/sec) of the tricuspid regurgitant jet; CVP = central venous pressure; RV = right ventricular; TAPSE = tricuspid annular plane of systolic excursion.

