FIGURE 2.

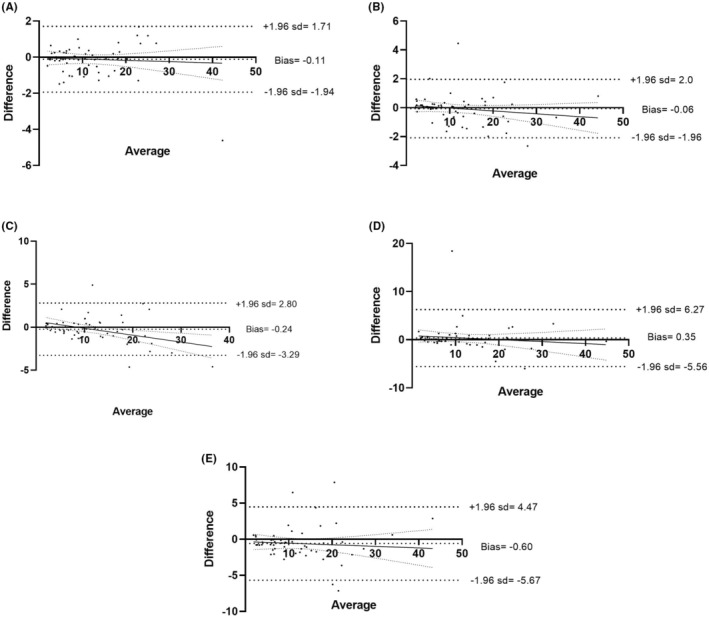
Comparison of A‐IPC‐delayed analysis in EDTA sample. Bland–Altman comparison between 1 and 0.5 h (A), 2 h (B), 4 h (C), 6 h (D) and 24 h (E).

Comparison of A‐IPC‐delayed analysis in EDTA sample. Bland–Altman comparison between 1 and 0.5 h (A), 2 h (B), 4 h (C), 6 h (D) and 24 h (E).