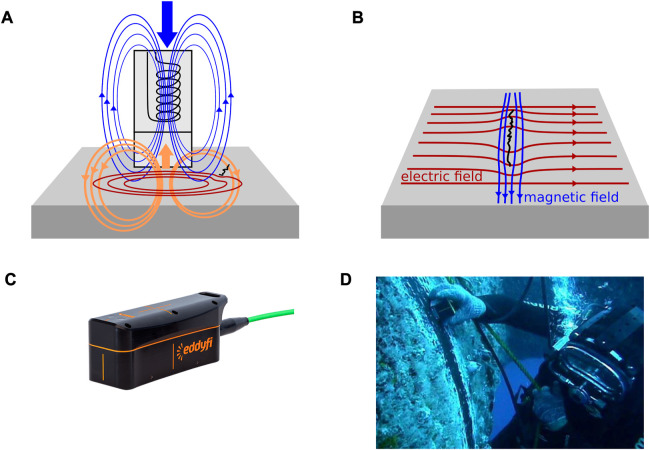
FIGURE 2.
Principals of different electromagnetic inspection methods. EC is displayed in (A), the generated magnetic field is shown in blue, the induced eddy currents in red and the measured magnetic field in orange. In (B) ACFM is shown. Tools for EC and ACFM measurements are shown in (C) and (D) (courtesy of Eddify Technologies).

