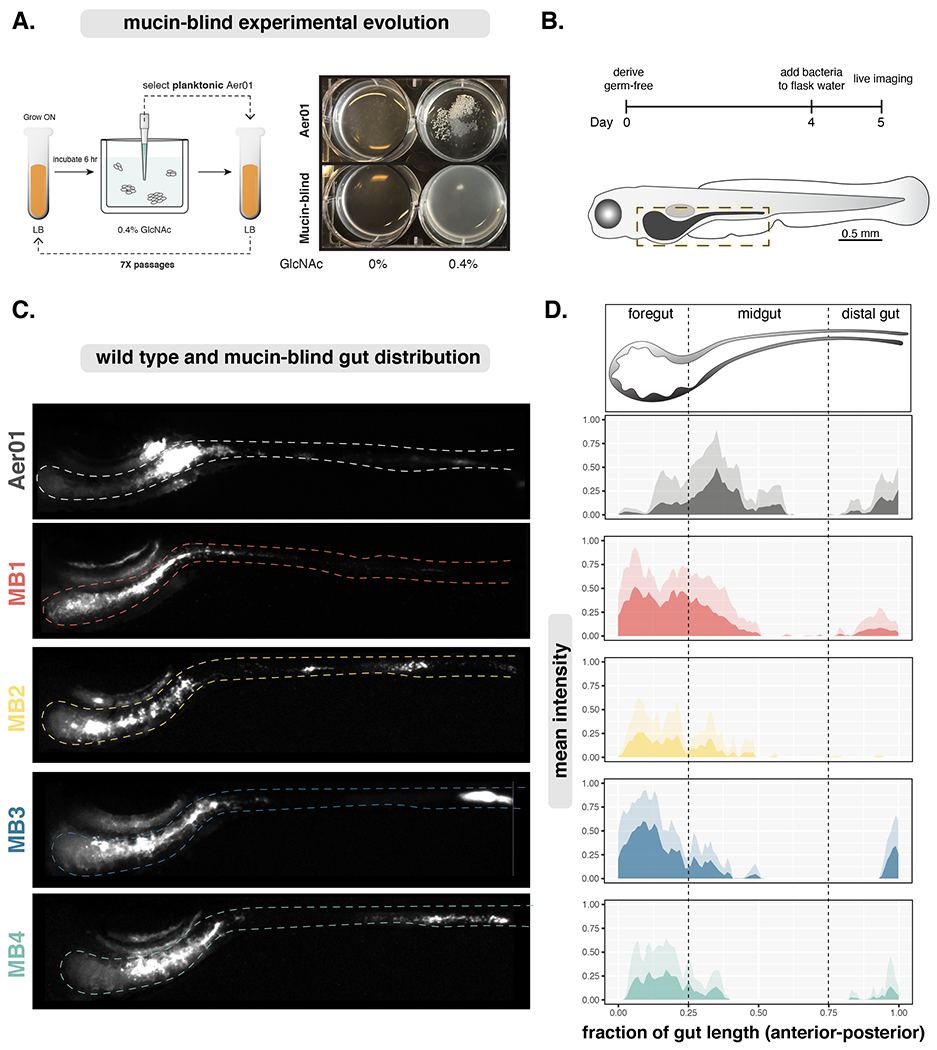
Figure 2. Defects in mucin responses alter Aer01 spatial organization in the intestine.

(A) Left: Experimental evolution schematic. Right: Evolved Aer01 are non-responsive to GlcNAc.
(B) Inoculation and imaging schedule for Aer01 and MB population structure analysis.
(C) Live stereoscope microscopy of population-level Aer01 and MB spatial organizations. The approximate intestinal boundary is outlined and corresponds the region measured for distribution analysis in (D).
(D) Quantification of bacterial spatial organization from lives images in (c). Mean pixel intensities (microbial abundance) are plotted along the normalized gut length and standard deviation at each point plotted in the corresponding lighter color. Aer01 (N=7), MB1 (N=7), MB2 (N=7), MB3 (N=5), MB4 (N=7).
