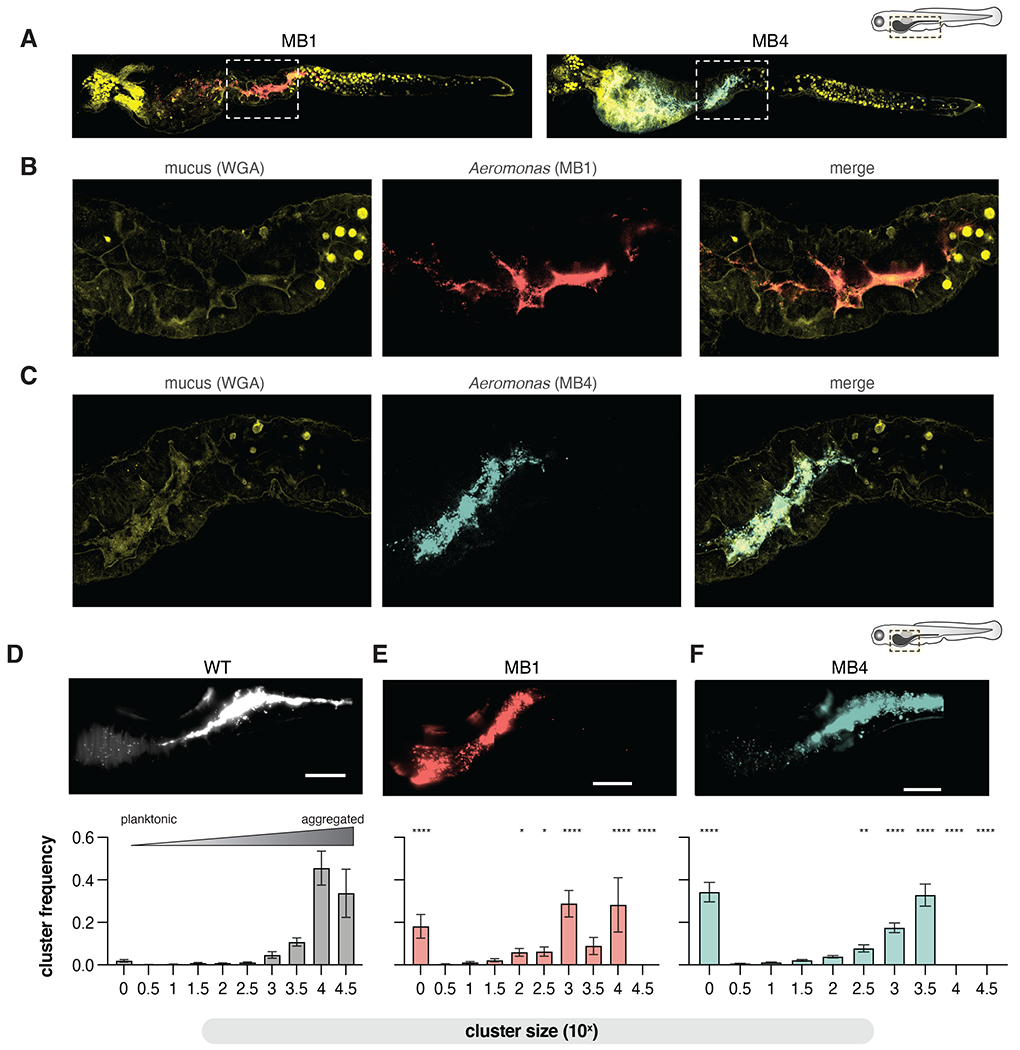
Figure 4. MB isolates are more planktonic in the mucus-rich lumen.

(A) Confocal microscopy showing MB1 (anti-dTom, red), MB4 (anti-dTom, blue), and mucus (WGA-488, yellow) distribution throughout the entire larval zebrafish gut.
(B-C) zoom in of the fore/mid-gut indicated in A and B boxed regions.
(D-F) Top: maximum intensity projections from live light sheet fluorescence microscopy of the distal foregut to proximal mid gut region of the larval zebrafish intestine showing population structures of WT, MB1, and MB4. Bottom: The probability of being in an n-cell cluster for WT, MB1, and MB4. The mean and standard deviation are indicated (WT, N=11; MB1, N=7, MB4, N=6). Two-way ANOVA with multiple comparisons to WT (*p <0.05, **p<0.01, ***p<0.0001). Scale bars=100 μm.
