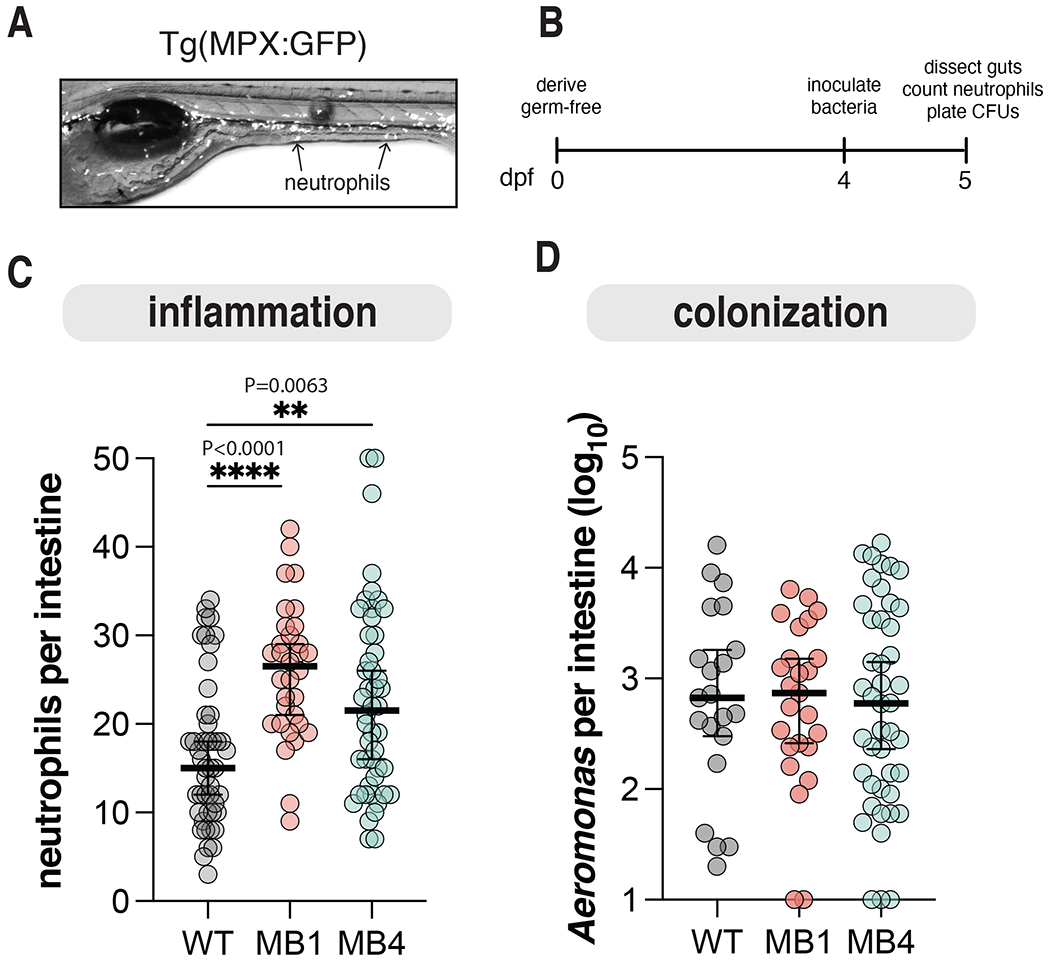
Figure 5. Mucin-blind isolates are more proinflammatory.

(A) Representative live fluorescence stereoscope microscopy image of Tg(MPX:GFP) larval zebrafish at 5 dpf. Arrows highlight neutrophils.
(B) Schedule for assaying Aer01 abundance and host intestinal inflammation.
(C) Neutrophil abundance from intestines of larval zebrafish mono-associated with the indicated Aer01 strain. Line and error bars represent median with 95% CI For all graphs each dot represents one fish; n ≥ 32 from at least 3 independent experiments. (WT, N=47; MB1, N=32; MB4, N=48). Ordinary one-way ANOVA was performed for Aeromonas abundance and neutrophils (P values: ****>0.0001, **=0.0063).
(D) Intestinal abundance of WT, MB1, and MB4. Line and error bars represent median with 95% CI. WT, N=23; MB1, N=26; MB4, N=46.
