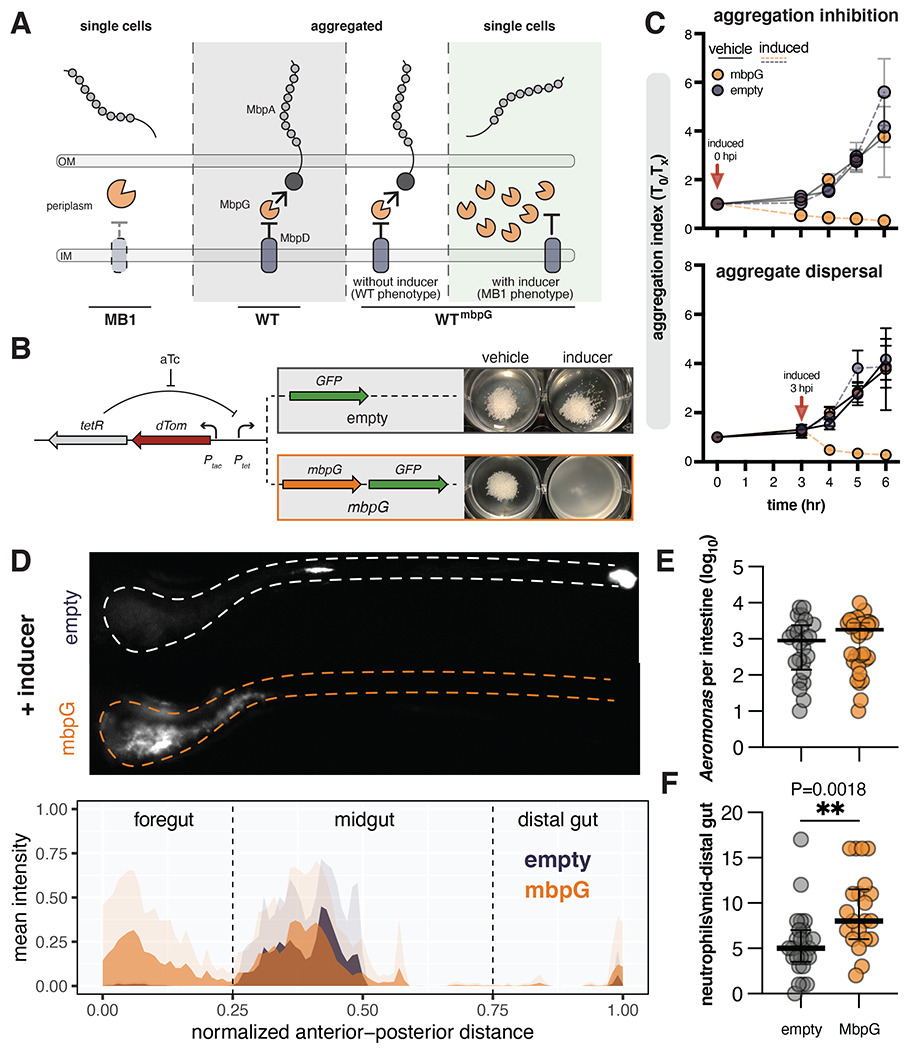
Figure 6. Disruption of MbpA function alters Aer01 spatial organization and increases intestinal inflammation.

(A) Model of MbpA regulation. Middle (WT) and left (MB1): loss of the protease regulator MbpD in the MB1 mutant leads to constitutive protease activity and MbpA inactivation. Over expression of the MbpA-targeting protease MbpG in WT (WTmbpG) can overcome MbpD regulation, leading to MbpA inactivation.
(B) Left: design of engineered construct to inactivate MbpA activity in WT Aer01. The addition of aTc activates expression of GFP control (empty) or mbpG and GFP (mbpG). Right: mbpG induction is sufficient to suppress GlcNAc-mediated WT Aer01 aggregation in culture.
(C) Induction of mbpG inhibits GlcNAc-mediated aggregation (top) and disperses formed aggregates (bottom). N=3.
(D) Inhibition of MbpA activity via mbpG induction alters WT Aer01 population structure in the intestine, leading to displacement into the foregut region. Top: representative image WT Aer01 carrying either the empty or mbpG constructs outlined in (B). Bottom: population structure analysis across the entire gut. Solid colors indicate the mean value at the normalized distance with transparent colors indicating the standard deviation. WTempty N=5; WTmbpG, N=11.
(E) Intestinal abundance of WTempty and WTmbpG. Line and error bars represent median with 95% CI Unpaired t test. WTempty N=24; WTmbpG, N=34.
(F) Inactivation of MbpA function increases the inflammation character of WT Aer01. Intestinal inflammation is indicated by neutrophil abundance in the mid to distal gut. Line and error bars represent median with 95% CI. Unpaired t test. WTempty, N=25; WTmbpG, N=21.
