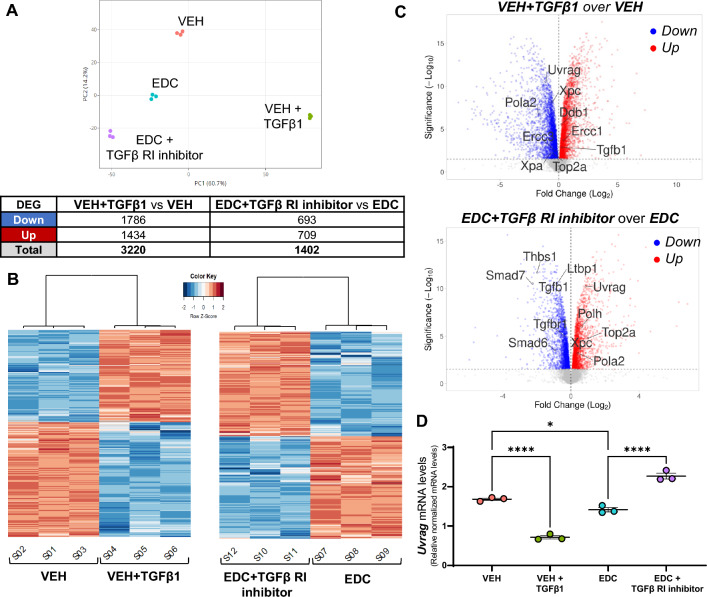
Fig. 4.
Effect of TGFβ1 pathway activation and inhibition on gene expression of rat VEH- and EDC-MMSCs. A Principal component analysis plot showing samples clustering and DEGs table (Fold change ≥ 1.5, FDR of 0.05). B Heatmaps representing the DEGs clustered using Pearson correlation in VEH-MMSCs treated with vehicle or TGFβ1 (10 ng/ml) for 48 h (left), and EDC-MMSCs treated with vehicle or TGFβ receptor I inhibitor (2 µM) for 24 h (right). Data are scaled by Z-score for each row. C Volcano plots showing genes downregulated (blue dots) or upregulated (red dots) statistically significant. D mRNA levels of Uvrag in VEH-MMSCs treated with vehicle or TGFβ1 (10 ng/ml) for 48 h, and EDC-MMSCs treated with vehicle or TGFβ receptor I inhibitor (2 µM) for 24 h. 18S was used to normalize the expression data. Data are shown as mean ± S.E.M. *p < 0.05, ****p < 0.0001

