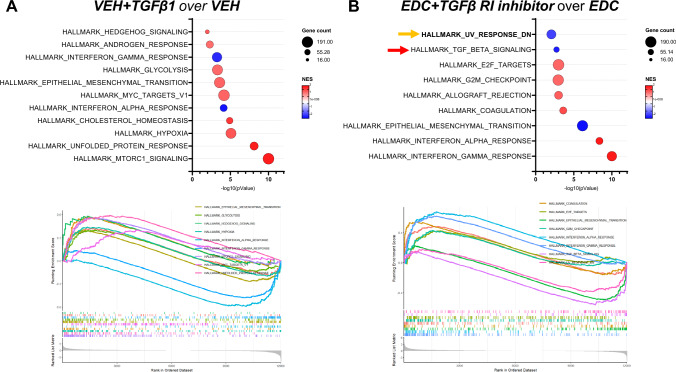
Fig. 5.
Effect of TGFβ1 pathway activation and inhibition on pathway enrichment of rat VEH- and EDC-MMSCs. A bubble chart of the gene set enrichment analysis (GSEA) (top) and enrichment plot (bottom) using the Hallmark MSigDB collection for A VEH-MMSCs treated with vehicle or TGFβ1, and B EDC-MMSCs treated with vehicle or TGFβ Receptor I inhibitor comparisons. Normalized enrichment score (NES) is a metric whose sign corresponds to which end of the dataset is enriched in the tested gene set. The arrows indicate enriched pathways related to NER (orange) and TGFβ (red) signaling

