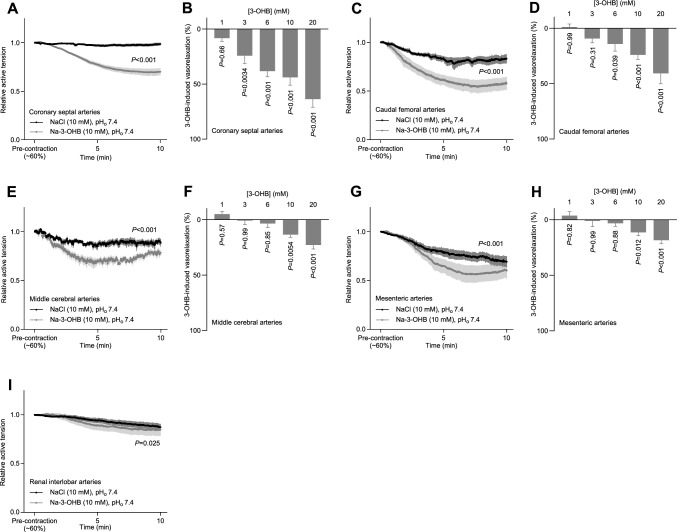
Fig. 4.
3-OHB-induced changes in vascular tone in different arterial beds. The vasorelaxant responses are shown relative to a stable U46619-induced pre-contraction. A + C + E + G + I, 3-OHB-induced changes in coronary septal (A, n = 13), caudal femoral (C, n = 6–7), middle cerebral (E, n = 5), mesenteric (G, n = 7), and renal interlobar (I, n = 7) artery tone. B + D + F + H, concentration-dependent vasorelaxant responses of coronary septal (B, n = 7), caudal femoral (D, n = 8), middle cerebral (F, n = 5), and mesenteric (H, n = 7) arteries to 3-OHB. Bars and symbols represent mean±SEM. In all cases, Na-3-OHB was compared to equimolar extra NaCl. Data in panels A, C, E, G, and I were compared by repeated-measures two-way ANOVA (interaction) or, in case of missing values, mixed-effects analysis. Data in panels B, D, F and H were compared by repeated-measures two-way ANOVA followed by Šídák's multiple comparisons tests

