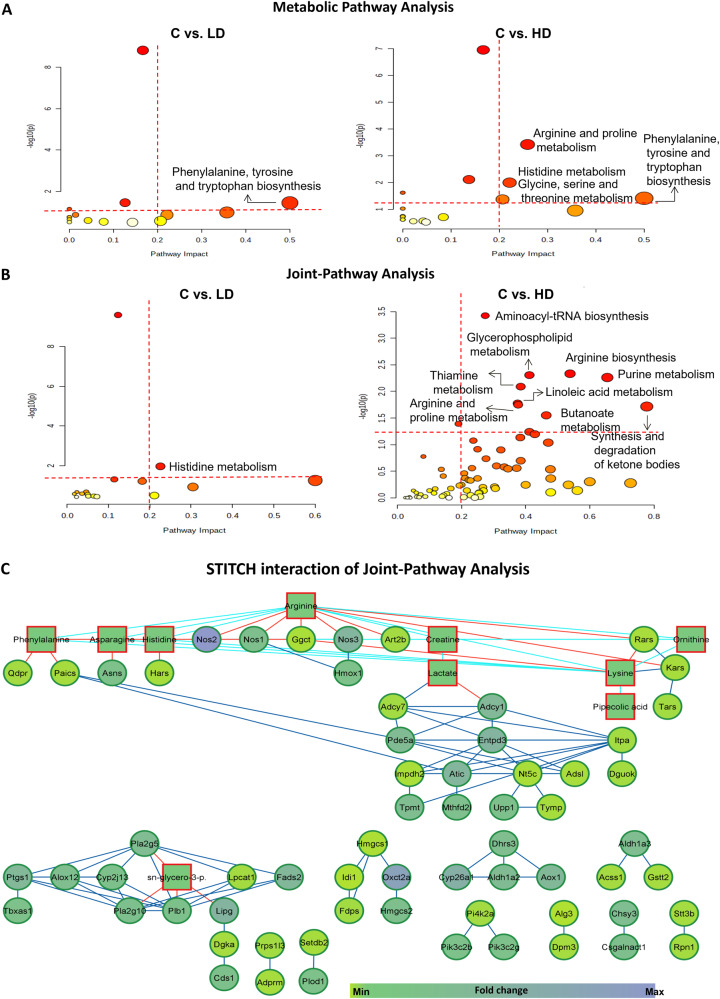
Fig. 3. Overview of dysregulated metabolic pathways after radiation exposure.
A KEGG pathway analysis of significantly changed metabolites using MetaboAnalyst. (p values shows pathway enrichment analysis using Global Test and pathway impact values shows the pathway topology analysis). B Joint-Pathway Analysis of significantly altered transcriptomic and metabolomic data after integration. Pathways having impact > 0.2 and –log 10(p) >1.3 (cutoff is highlighted in red dotted lines) were taken into consideration. Each circle represents a single metabolic pathway with area of circle proportional to pathway impact whereas color represents the pathway significance from highest (red) to lowest (yellow). (Enrichment analysis was performed based on hypergeometric test whereas topology measure was performed by degree centrality). C Network visualization of STITCH interactions by Cytoscape in HD group. Networking shows interactions between significant metabolites (p-value < 0.05; square) and DEGs (adj. p-value < 0.05; circle) with the thickness of edge proportional to the interaction score in the STITCH database. Node color shows minimum and maximum fold change. Red, blue and dark blue edge color represents the interaction between metabolite-gene, metabolite-metabolite and gene-gene respectively.

