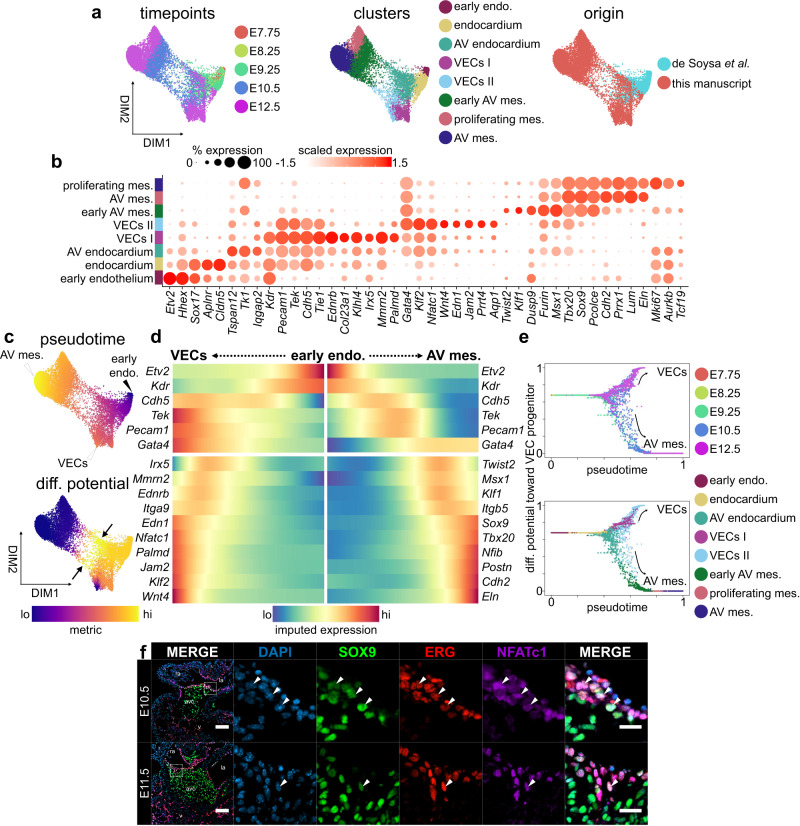
Fig. 2. Endocardial and mesenchymal cell lineage bifurcation during EndMT.
a Force-directed layouts of 10,354 endocardial and endocardial-derived cells displaying timepoint, annotated cluster, and origin. b A dot plot displaying select genes enriched within endothelial-derived clusters, including VEC populations and AV mesenchyme. Size of the dot represents proportion of the cluster that expresses each gene. Colour indicates level of expression. c Force-directed layouts of 10,354 endocardial and endocardial-derived cells displaying pseudotime and differentiation (diff.) potential. Arrows indicate high diff. potential in domains of endothelial-mesenchymal plasticity (EMP). d Gene trends along pseudotime show bifurcation between VEC and AV mesenchymal trajectories during the endocardial-to-mesenchymal transition. e Differentiation potential as a function of pseudotime for endothelial-derived lineages progressing toward a VEC terminus. Each dot represents a single-cell that is colour-coded by embryonic timepoint or cluster. f Immunostaining of AV canals for SOX9, ERG, and NFATc1 shows co-expression of on the flow side of the valves (white arrowheads) at E10.5 (n = 10) and E11.5 (n = 4). Scale bars: 100 µm, 25 µm in regions of interest (ROIs). AV atrioventricular, endo. endothelium, mes. mesenchyme. See also Supplementary Fig. 2 and Supplementary Data 2.

