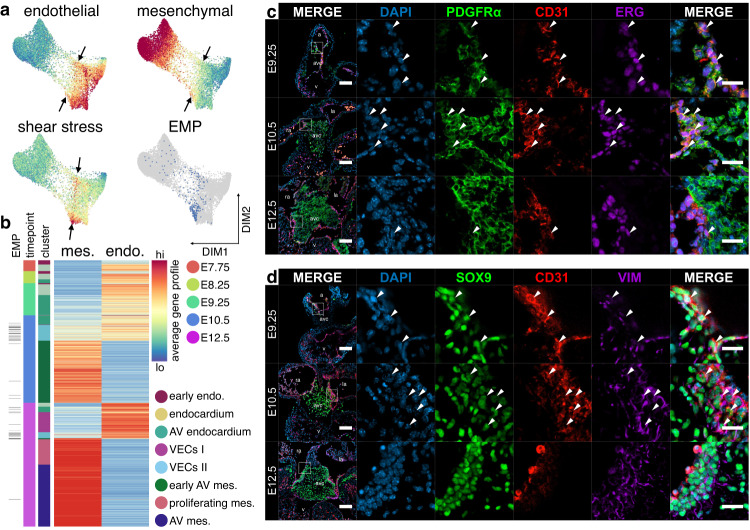
Fig. 3. Activation of epithelial-mesenchymal plasticity during EndMT.
a Force-directed layouts of 10,354 endocardial and endocardial-derived cells displaying average gene profiles denoting expression of endothelial and mesenchymal biomarkers as well as transcriptional response to shear stress, highlighting domains of EMP or high fluid shear stress response (arrows). b Heatmaps displaying average endothelial and mesenchymal gene profiles for endocardial and endocardial-derived cells from E7.75-12.5, where overlap indicates emergence of EMP. Immunostaining of AV canals for (c) PDGFRα, CD31, and ERG or (d) SOX9, CD31, and vimentin show widespread co-expression of endothelial and mesenchymal biomarkers, primarily at E9.25 and E10.5, suggesting EMP (arrowheads). Results are representative of three to nine independent experiments. Scale bars: 100 µm, 25 µm in ROIs. AV atrioventricular, endo endothelium, mes mesenchyme, VECs valve endocardial cells. See also Supplementary Fig. 3 and Supplementary Data 2 and 4.

