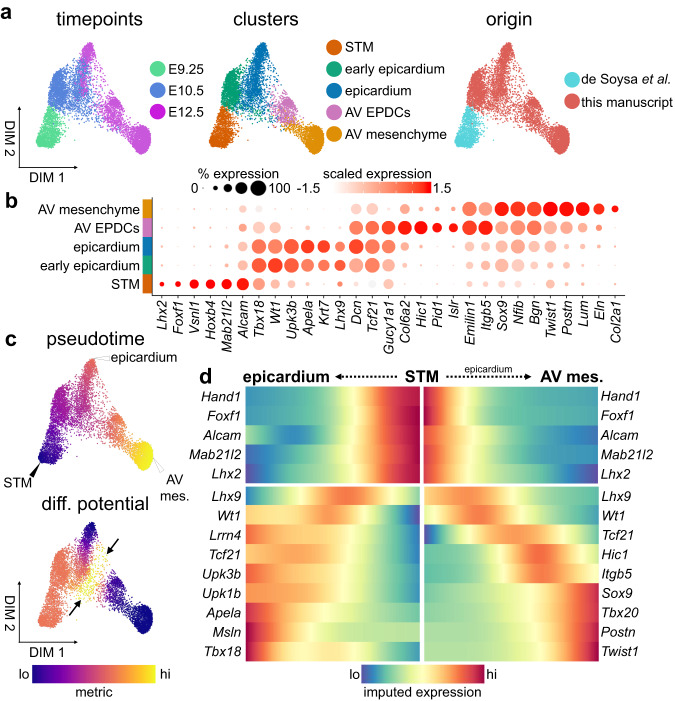
Fig. 5. The epicardial-to-mesenchymal transition progresses through a distinct cell type.
a Force-directed layouts of 4633 epicardial cells displaying timepoint, annotated cluster, and origin. b A dot plot displaying select genes enriched within epicardial clusters, including AV epicardial-derived cells (EPDCs) and mesenchyme. Size of the dot represents proportion of the cluster that expresses each gene. Colour indicates level of expression. c Force-directed layouts of 4633 epicardial cells displaying pseudotime and differentiation (diff.) potential. Arrow indicates differentiation potential maximum where AV EPDCs are specified. d Gene trends along pseudotime show bifurcation between epicardial and AV mesenchymal trajectories during the epicardial-to-mesenchymal transition. AV atrioventricular, epi epicardium, mes mesenchyme, STM septum transversum mesenchyme. See also Supplementary Fig. 5 and Supplementary Data 2.

