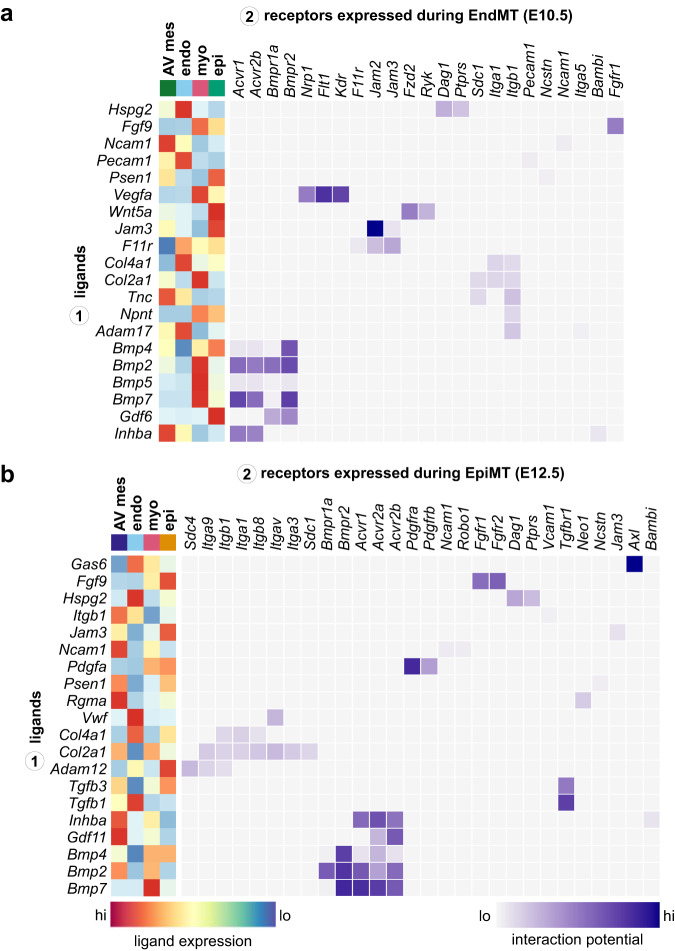
Fig. 7. Deconvolution of signalling microenvironment during EndMT and EpiMT.
a A heatmap displaying select candidate ligand-receptor interactions signalling toward endocardial cells at E10.5 during EndMT, including scaled and log-normalized expression of ligands from sender populations. b A heatmap displaying select candidate ligand-receptor interactions signalling toward epicardial cells at E12.5 during EpiMT, including scaled and log-normalized expression of ligands from sender populations. AV atrioventricular, endo endocardium, epi epicardium, myo myocardium. See also Supplementary Fig. 7 and Supplementary Data 2 and 8.

