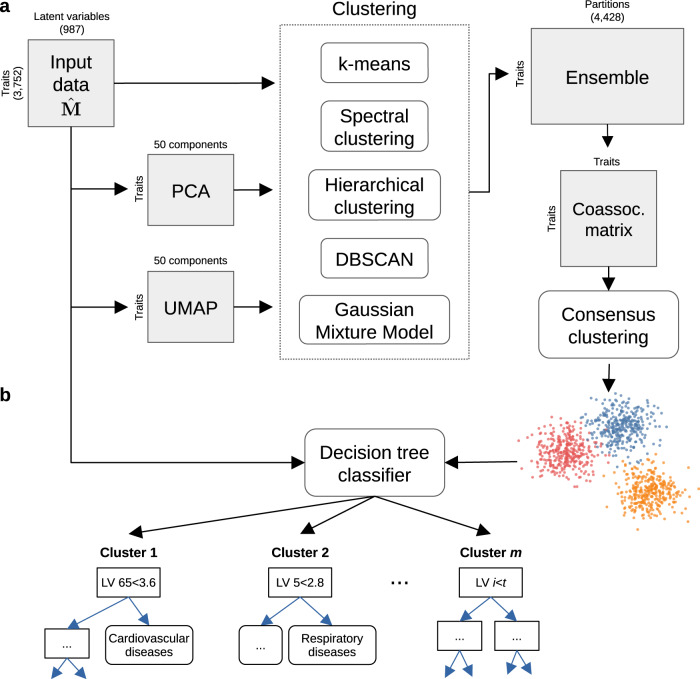
Fig. 5. Cluster analysis on traits using the latent gene expression representation.
a The projection of TWAS results on 3752 traits into the latent gene expression representation is the input data to the clustering process. A linear (PCA) and nonlinear (UMAP) dimensionality reduction techniques were applied to the input data, and five different clustering algorithms processed all data versions. These algorithms derive partitions from the data using different parameters (such as the number of clusters), leading to an ensemble of 4428 partitions. Then, a distance matrix is derived by counting how many times a pair of traits was grouped in different clusters across the ensemble. Finally, a consensus function is applied to the distance matrix to generate consolidated partitions with different numbers of clusters (from 2 to 60). These final solutions were represented in the clustering tree (Fig. 6). b The clusters found by the consensus function were used as labels to train a decision tree classifier on the original input data, which detects the LVs that better differentiate groups of traits.

