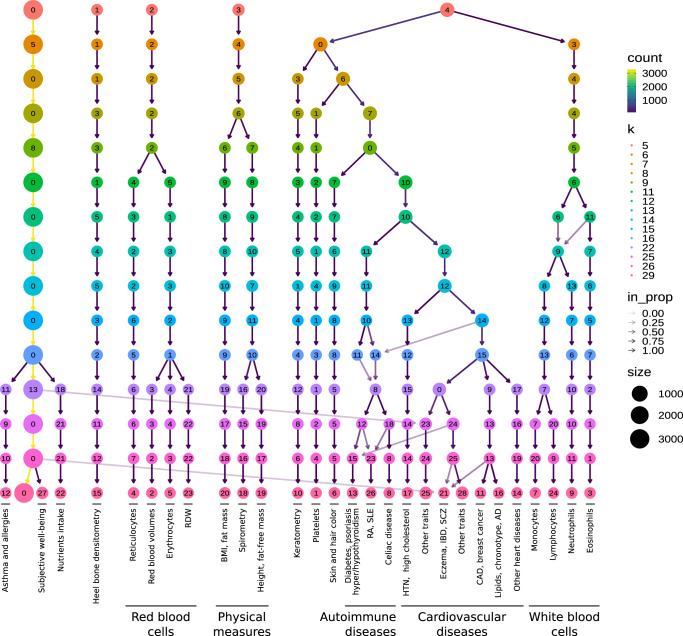
Fig. 6. Clustering tree using multiple resolutions for clusters of traits.
Each row represents a partition/grouping of the traits, and each circle is a cluster from that partition. The number of clusters goes from 5 to 29. Arrows indicate how traits in one cluster move across clusters from different partitions. Most of the clusters are preserved across different resolutions, showing highly stable solutions even with independent runs of the clustering algorithm. RDW red cell (erythrocyte) distribution width; BMI body mass index; WC waist circumference; HC hip circumference; RA rheumatoid arthritis; SLE systemic lupus erythematosus; HTN Hypertension; IBD inflammatory bowel disease; SCZ Schizophrenia; CAD Coronary artery disease; AD Alzheimer’s disease; The full lists of traits in each cluster in the last five partitions of the tree (from k = 16 to k = 29) are in Supplementary Data 3-7.

