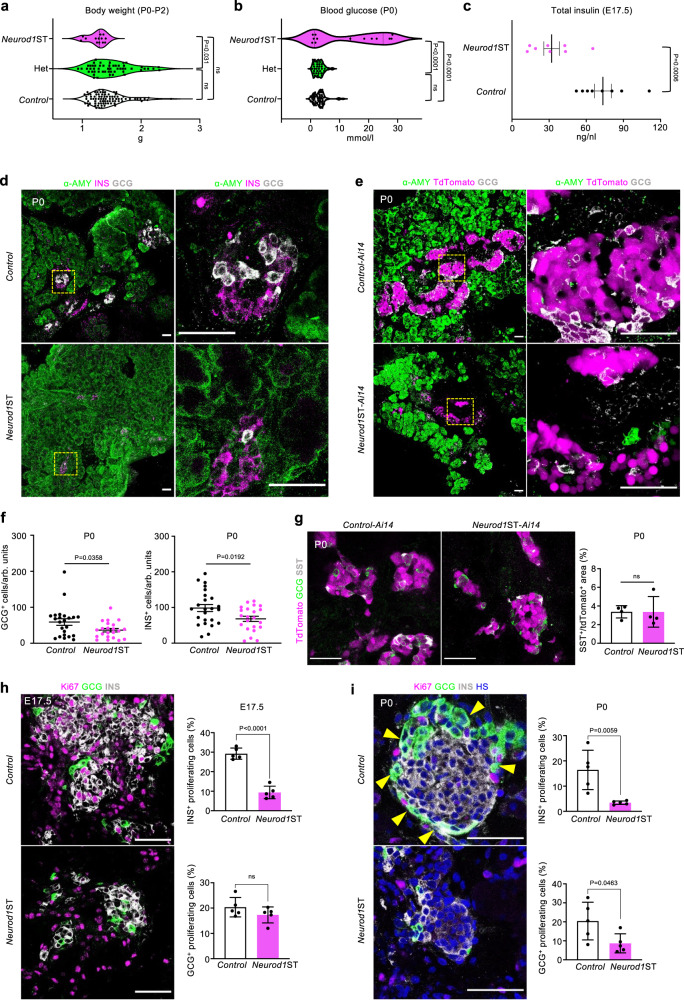
Fig. 1. Neurod1ST mice demonstrate a severe diabetic phenotype with reduced endocrine cell mass.
a Genotype-determined differences in the measured values of body weight in newborn mice at postnatal day P0-P2 (One-way ANOVA, Tukey’s multiple comparisons test). b Differences in blood glucose in newborn mice fed ad libitum at P0 (One-way ANOVA, Tukey’s multiple comparisons test). c Total pancreatic insulin levels at embryonic day 17.5, E17.5 (n = 8 pancreases/group). Data are presented as mean ± SEM. d Representative immunostaining for α-amylase (α-AMY, a marker of exocrine tissue), glucagon (GCG), and insulin (INS) in pancreatic tissue sections of Control and Neurod1ST at P0. Boxes indicate the areas magnified in the right panels. e Representative microscopy images of tdTomato+ cells and immunostaining of α-AMY, and GCG in P0 pancreatic tissue sections of Control-Ai14 and Neurod1ST-Ai14. Boxes indicate the areas magnified in the right panels. f The number of GCG+ and INS+ cells counted in the central section with the largest pancreatic footprint of Neurod1ST and Control pancreases per arbitrary unit (arb. units = 0.0003 mm3; n = 24 views of area/Control from 5 pancreases and 22 views of area/Neurod1ST from 5 pancreases). Data are presented as mean ± SEM. g Representative images of immunolabeled somatostatin+ (SST+) cells and quantification of the percentage of SST+ per tdTomato+ endocrine cells at P0 (n = 4 pancreases/genotype). Data are presented as mean ± SD. h, i Quantification of the percentage of proliferating INS+ and GCG+ cells in the Neurod1ST and Control pancreas at E17.5 and P0. Representative immunostainings for proliferation marker, Ki67, β-cells expressing INS, and α cells expressing GCG. GCG+ cells forming the mantle around INS+-cell core in the Control are indicated by arrows (in i). Note a disrupted islet core-mantle organization in Neurod1ST with a missing mantle of GCG+ cells around β-cell core compared to Control. Nuclei were stained by Hoechst (HS). Data are presented as mean ± SD (n = 5 pancreases/genotype/each age). Unpaired two-tailed t test (c, f–i). Source data for (a–c, f–i) are provided as a Source Data file. Scale bars, 50 µm. ns not significant.

