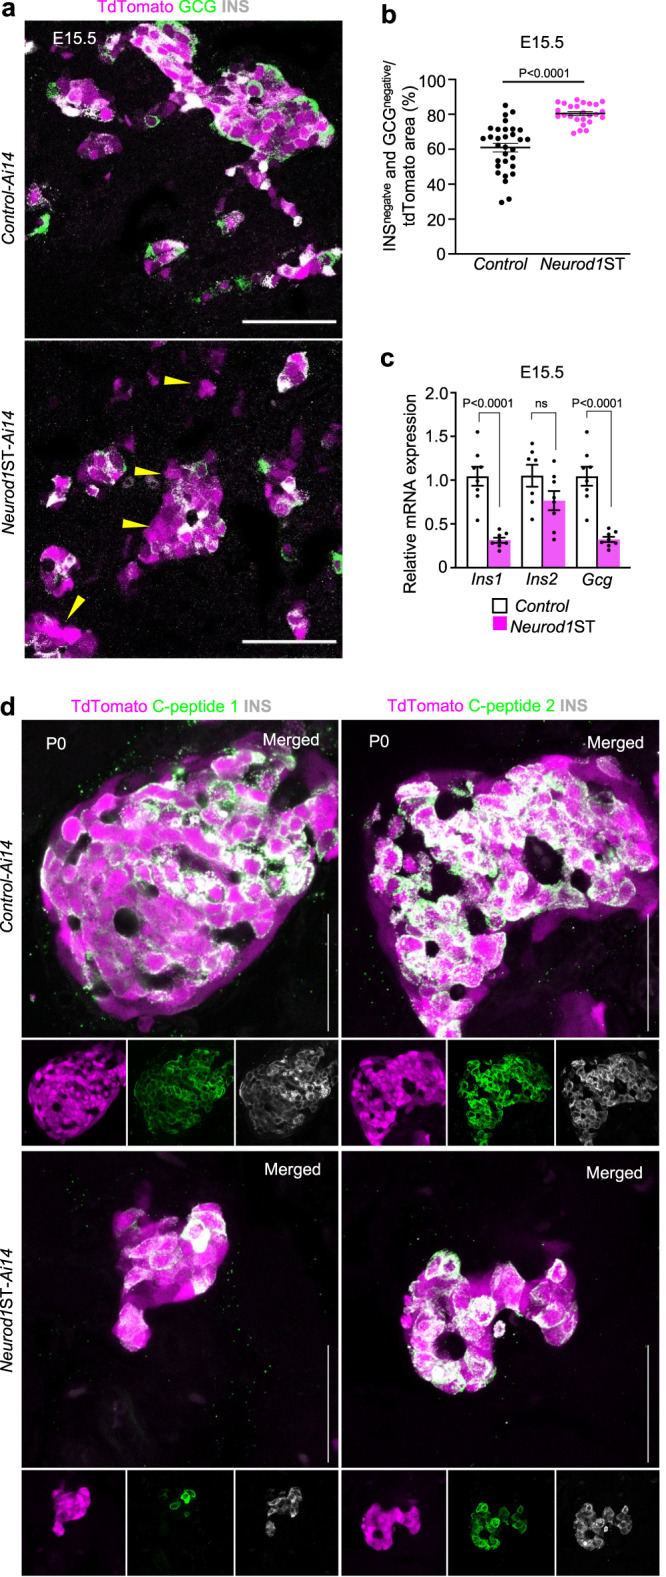
Fig. 3. Neurod1 deficiency results in decreased hormone production.

a Representative confocal microscopy images of tdTomato+ cells and immunostaining of glucagon (GCG), and insulin (INS) during the secondary transition at E15.5. Note the increased number of tdTomato+ cells without a detectable expression of INS or GCG (arrowheads). b Quantification of tdTomato+ area without GCG and INS expression in the central section of pancreas with the largest pancreatic footprint. Data are presented as mean ± SEM; (n = 31 tdTomato+ areas/Control from 4 pancreases and 25 tdTomato+ areas/Neurod1ST from 4 pancreases); unpaired two-tailed t test. Source data are provided as a Source Data file. c Relative mRNA expression of glucagon (Gcg), insulin 1 (Ins1), and insulin 2 (Ins2) by RT-qPCR using RNA extracted from E15.5 pancreases. Data are presented as mean ± SEM; (n = 8 pancreases/genotype); unpaired two-tailed t test, Source data are provided as a Source Data file. d Representative confocal microscopy images of tdTomato+ cells and immunostaining of INS, C-peptide 1 and C-peptide 2 in P0 pancreatic tissue sections. Scale bars, 50 µm. ns, not significant.
